Synthetic Vision Technology for Unmanned Aerial Systems: The Real
Story
By Jed Margolin
January 7, 2009
Contents
Digital Terrain
Elevation Database
Displaying the Digital Elevation Database
Visual-Proprioceptive Cue Conflicts in the
Control of Remotely Piloted Vehicles, Reed, 1977
When Did
NASA Start Working on Synthetic Vision?
Other References
cited by the AUVSI Authors
"Pathway-in-the-Sky Contact Analog Piloting Display,"
Knox and Leavitt, 1977
“The Electronic Terrain Map: A New Avionics Integrator,"
Small, D.M., 1981
"VCASS: An Approach to Visual Simulation," Kocian, 1977
U.S. Patent 5,566,073 Pilot Aid
Using A Synthetic Environment issued October 15, 1996 to Margolin
The Future of Synthetic Vision
Introduction
This is in response to
the article Synthetic Vision Technology for Unmanned Systems: Looking Back
and Looking Forward by Jeff Fox, Michael Abernathy, Mark Draper and Gloria
Calhoun which appeared in the December 2008 issue of AUVSI’s Unmanned Systems
(page 27). {Ref. 1}
The AUVSI Authors have
used the term “synthetic vision” so loosely that many readers will believe it
was invented long before it actually was. This is an important issue. Aerospace
is a field where precision and accuracy is critical. There are also patent
rights involved. In the interests of full disclosure I am the listed inventor
on several patents relating to synthetic vision and there is a patent
infringement disagreement between the owner of the patents (Optima Technology
Group) and the company that one of the AUVSI Authors is affiliated with (Rapid
Imaging Software).
What Is Synthetic Vision?
The term “Synthetic
Vision” originally meant anything that you put up on a video display.
For example, there is
U.S. Patent 5,593,114 Synthetic Vision Automatic Landing System issued
January 14, 1997 to Ruhl (Assignee McDonnell Douglas Corporation). {Ref. 2}
From Column 2, lines 16
- 27:
The instant invention
is an Enhanced or Synthetic Vision (also called Autonomous) Landing System
(E/SV). This system allows the pilot to view the approach scene with the use of
a forward looking radar or equivalent sensor which provides the means of
identifying the runways and the airport and land the aircraft using the
automatic landing systems on virtually all types of aircraft. A pilot
effectively turns the flight task during zero visibility or other low
visibility weather conditions into a synthetic "see to land" approach
because the image from the forward looking sensor provides sufficient detail to
turn any instrument landing into what appears to be a visual landing.
In this patent Enhanced or Synthetic Vision is a display of
the data from a forward looking radar or equivalent sensor.
This was also the FAA’s
definition at the time, in their Synthetic Vision Technology
Demonstration, Volume 1 of 4, Executive Summary (Ref 3}. From PDF page 10:
1.1 BACKGROUND
In 1988 the Federal
Aviation Administration (FAA), in cooperation with industry, the United States
Air Force (USAF), the Navy, and several other government organizations
initiated an effort to demonstrate the capabilities of existing technologies to
provide an image of the runway and surrounding environment for pilots operating
aircraft in low visibility conditions. This effort was named the Synthetic
Vision Technology Demonstration (SVTD) program. Its goal was to document and
demonstrate aircraft sensor and system performance achieved with pilots using
millimeter wave (MMW) radar sensors, a forward-looking infrared (FLIR) sensor,
and a head-up display (HUD).
And from PDF pages
11,12:
1.2. OBJECTIVE
The objective of the Synthetic Vision Technology Demonstration
program was to develop, demonstrate, and document the performance of a
low-visibility, visual-imaging aircraft landing system. The experimental
Synthetic Vision System components included on-board imaging sensor systems
using millimeter-wave and infrared technology to penetrate fog, and both
head-up (HUD) and head-down (HDD) displays. The displays presented the
processed raster image of the forward scene, combined with suitable
avionics-based stroke symbology for the pilot's use during a manually flown
approach and landing. The experimental system, sometimes referred to as a
functional prototype system, included all the functions (in prototype form
only) required to accomplish precision, non-precision, and non-instrument
approaches and landings in low visibility weather conditions.
In the AUVSI Authors’
own article they equate “pictorial format avionics” with “synthetic
vision.” [Paragraph 10]:
Pictorial format avionics (i.e., synthetic vision) formed a key
ingredient of the Air Force Super Cockpit concept.
Boeing’s report Multi-Crew
Pictorial Format Display Evaluation {Ref. 4} describes what
Pictorial
Format means (PDF Page 17):
The Multi-Crew Pictorial format Display Evaluation Program is the
third in a series of contracted efforts, sponsored primarily by the Air Force
Flight Dynamics Laboratory, Crew Systems Development Branch, (AFWAL/FIGR). In
the first of these efforts, conceptual displays were developed for six
primary fighter crew station functions: primary flight, tactical
situation, stores management, systems status, engine
status, and emergency procedures (Jauer and Quinn, 1982).
In the second contract, Pictorial Format Display Evaluation
(PFDE), the Boeing Military Airplane Company continued the development beyond
the paper formats of the earlier program and implemented the results in a
piloted simulation. Two simulation studies were conducted to evaluate the
usability and acceptability of pictorial format displays for single-seat
fighter aircraft; to determine whether usability and acceptability were
affected by display mode -- color or monochrome; and to recommend format
changes based on the simulations. In the first of the two PFDE studies, pictorial
formats were implemented and evaluated for flight, tactical situation, system
status, engine status, stores management, and emergency status displays.
The second PFDE study concentrated on the depiction of threat data. The
number of threats and the amount and type of threat information were increased.
Both PFDE studies were reported in Way, Hornsby, Gilmour, Edwards and Hobbs,
1984.
Pictorial Format
Avionics is pictures. That explains why it is called Pictorial
Format Avionics.
Why can’t we use the
term “Synthetic Vision” to mean anything we want it to mean?
1. It is sloppy.
2. The FAA has a definition for “Synthetic Vision” and if you want an
FAA type certificate for your Synthetic Vision product you have to use their
definition.
{Ref. 5 – FAA current definition of synthetic
vision}
Synthetic vision means a computer-generated image of the external scene topography from the perspective of the flight deck that is derived from aircraft attitude, high-precision navigation solution, and database of terrain, obstacles and relevant cultural features.
{Emphasis added}
{Ref. 6 – FAA Synthetic
Vision is based on a Digital Elevation Database}
“Everyone gets their data from the same original source.”
“If accuracy of data base must be validated then SV is unapproveable.”
“Current resolution
tends to round-up the elevation data so that small errors are not as
significant and on the conservative side.”
{Emphasis added}
Therefore, Synthetic
Vision means a computer-generated image of the external scene topography from
the perspective of the flight deck that is derived from aircraft attitude,
high-precision navigation solution, and digital terrain elevation database,
obstacles and relevant cultural features.
Implicit in this is that
in order for the external scene topography to be viewed from the perspective of
the flight deck it has to be a 3D projected view and that the digital terrain
elevation database must represent real terrestrial terrain, as opposed to
terrain that is simply made up.
Digital Terrain Elevation Database
The Digital Terrain Elevation Database is also called
the Digital Elevation Database or Digital Elevation Model. From Ref. 7:
The USGS Digital
Elevation Model (DEM) data files are digital representations of cartographic
information in a raster form. DEMs consist of a sampled array of elevations for
a number of ground positions at regularly spaced intervals. These digital
cartographic/geographic data files are produced by the U.S. Geological Survey
(USGS) as part of the National Mapping Program and are sold in 7.5-minute,
15-minute, 2-arc-second (also known as 30-minute), and 1-degree units. The 7.5-
and 15-minute DEMs are included in the large scale category while 2-arc-second
DEMs fall within the intermediate scale category and 1-degree DEMs fall within
the small scale category - (Source: USGS)
The Digital Elevation
Model was substantially improved by STS-99 when Endeavour's international
crew of seven spent 11 days in orbit during February 2000 mapping the Earth's
surface with radar instruments. {Ref. 8}
Displaying
the Digital Elevation Database
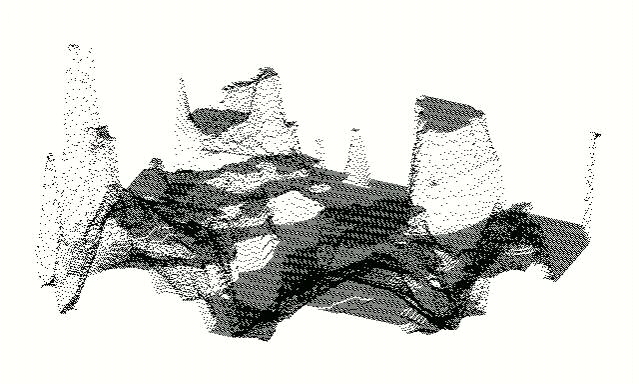
Now that we have a Digital Elevation Database consisting of
a sampled array of elevations for a number of ground positions at regularly
spaced intervals, what do we do with it? The database is just elevation points.
If you display only points there is no way to remove "hidden points" because there are no surfaces to test them against. (Things can only be hidden behind surfaces.) The result is a jumble which looks like this (the only useful features are the highest peaks):
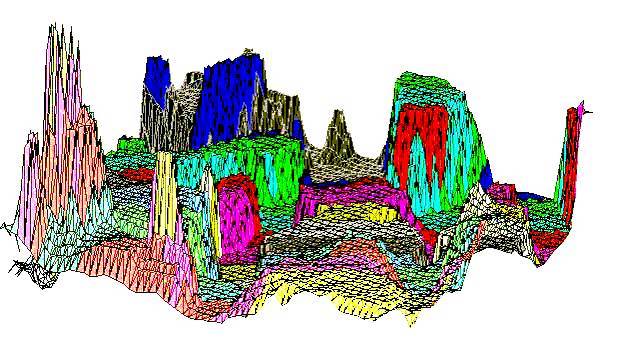
This following picture shows the same scene rendered
in polygons. (The polygons are crude because I had only a few colors to
work with and there is no clipping, only polygon sorting):
After you have used the
digital elevation points to produce polygons you can shade and blend the
polygons so that the underlying polygons may no longer be obvious. Honeywell
did an excellent job in their IPFD (Instrument Primary Flight Display) {Ref. 9}:
NASA HiMAT
The AUVSI Authors have
gone to considerable lengths to persuade readers that NASA’s HiMAT project was
Synthetic Vision [Paragraphs 11 – 14]. It wasn’t.
HiMAT - Summary
Sarrafian (Ref. 11}
1. "The vehicle was flown
with cockpit display instruments until the landing approach phase of the flight
when the camera aboard the aircraft was activated to provide the pilot with a
television display during the approach."
2. During the operational phase of the HiMAT program, a
simulator was used to adjust the control laws for the primary control system.
The display presented to the pilot of this simulated system was a display
of an instrument landing system (ILS).
3. Separately, a study was undertaken to compare
evaluations of pilots using a simulated visual display of the runway scene
and a simulated ILS display with the results of actual flight tests,
using the HiMAT aircraft as a representative remotely piloted research vehicle.
There is no mention of a terrain database or any suggestion that the simulated
visual display of the runway scene was ever used to control a real aircraft. It
was never anything other than a simulation.
From Evans and Schilling
{Ref. 13}:
Visual Landing Aid
Actual. - Cues to the pilot during landing included the cockpit
instruments, ILS/glideslope error indicators, television transmission from the
vehicle, calls on the radio from the chase pilot, and space-positioning calls
from the flight-test engineer.
Simulation model. - For most of the program, the landing cues for the pilot
in a HiMAT simulation included only the instruments, mapboards, and the
ILS/glideslope error indicators. Although these are all valid cues, they could
not achieve the same effect as the television transmission used in actual
flight. During flight, as soon as the pilot can identify the runway, his scan
focuses more on the television picture and less on the cockpit instruments. To
help alleviate this lack of fidelity in the simulation, a display of the runways
on the dry lakebed was developed on a recently purchased Evans and Sutherland
Graphics System.
HiMAT Details
From NASA's description of the HiMAT project {Ref. 10}:
Highly Maneuverable Aircraft Technology
From mid-1979 to January 1983, two remotely piloted, experimental Highly Maneuverable Aircraft Technology (HiMAT) vehicles were used at the NASA Dryden Flight Research Center at Edwards, Calif., to develop high-performance fighter technologies that would be applied to later aircraft. Each aircraft was approximately half the size of an F-16 and had nearly twice the fighter's turning capability.
and, later:
The small aircraft were launched from NASA's B-52 carrier plane at an altitude of approximately 45,000 feet. Each HiMAT plane had a digital on-board computer system and was flown remotely by a NASA research pilot from a ground station with the aid of a television camera mounted in the cockpit. There was also a TF-104G chase aircraft with backup controls if the remote pilot lost ground control.
NASA's article says it was flown remotely by a pilot
using a television camera in the aircraft. It does not say it was flown using
what is now known as synthetic vision. (As previously explained, the definition
of the term "synthetic vision" has changed over the years.)
It does say:
Dryden engineers and
pilots tested the control laws for the system, developed by the contractor, in a
simulation facility and then in flight, adjusting them to make the system work
as intended.
and that is where the AUVSI Authors have gone astray,
whether deliberately or through poor scholarship.
The AUVSI Authors cite the report by Shahan
Sarrafian,"Simulator Evaluation of a Remotely Piloted
Vehicle Lateral Landing Task Using a Visual Display." There are two
Sarrafian reports with that title, one dated May 1984; the other dated August
1984. See Ref. 11 which contains links to the reports as well
as to mirrored copies. The August 1984 report has been converted to text to make
it easy to search and to quote from.
The title of the Sarrafian report gives an accurate
description of his project, "Simulator Evaluation of a
Remotely Piloted Vehicle Lateral Landing Task Using a Visual Display."
It was a simulation.
Here is the Introduction from the report. It's a
little long but it describes the heart of the matter. I have underlined the
parts that are especially relevant.
Introduction
The remotely piloted research vehicle
(RPRV) is a tool that can be used for exploring unproven and advanced
technologies without risking the life of a pilot. The flight testing of RPRVs(l)
allows programs to be conducted at a low cost, in quick response to demand, or
when hazardous testing is required to assure the safety of manned vehicles. Yet
this type of testing must be performed by the most versatile system available -
the pilot. The pilot has the same responsibilities and tasks as if he were
onboard the aircraft; this includes guiding the vehicle to a safe landing. The
only difference is that he must accomplish this final task from a ground-based
cockpit.
The
highly maneuverable aircraft technology (HiMAT) aircraft (Fig. 1) is a remotely
piloted research vehicle that has completed flight tests to demonstrate advanced
fighter technologies at NASA Ames Research Center's Dryden Flight Research
Facility. The HiMAT vehicle is a 0.44-scale version of an envisioned small,
single-seat fighter airplane. The mission profile of HiMAT (Fig. 2) included a
launch from a B-52 aircraft and the acquisition of flight test data. The vehicle
was then flown by a NASA test pilot in a fixed ground-based cockpit to a
horizontal landing on the Edwards dry lakebed. The
vehicle was flown with cockpit display instruments until the landing approach
phase of the flight when the camera aboard the aircraft was activated to provide
the pilot with a television display during the approach.
During the operational phase of the HiMAT program, the
lateral-stick gearing gain used in the aircraft approach was altered from a
variable gain schedule (derived from simulation) to a constant gain
schedule. The schedules were changed in response to pilot complaints about
oversensitivity in the lateral stick that required high pilot compensation. Before the modified gain schedule was implemented into the
primary control system (PCS), it was evaluated in the HiMAT simulator using an
instrument landing system (ILS) display; the schedule was found to be
satisfactory. Postflight comments from HiMAT pilots indicated that the
handling qualities during landing approach were significantly improved as a
result of the modified gain schedule.
In a separate
development, a visual display that was used for engineering purposes was
implemented into the simulator during the latter portion of the flight test
program when simulation was no longer required to support the remaining flights.
While the addition of a visual display is known to significantly improve the
fidelity of a simulation system, the need for such a system in RPRV simulation
at Ames Dryden was felt to be reduced since pilots had an opportunity to conduct
proficiency flights with an RPRV Piper Comanche PA-30 aircraft. Nevertheless, when a visual display became available in the
simulation laboratory, a decision was made to determine the effectiveness of
this type of visual display in the simulation of visual RPRV flight. The
RPRV evaluation described in this paper was designed to focus on the utility of
a visual display of this type while studying the influence of changes in
lateral-stick gearing gains of remotely piloted research vehicle handling
qualities during simulated approaches and landings. This
study was undertaken to compare evaluations of pilots using a simulated visual
display of the runway scene and a simulated ILS display with the results of
actual flight tests, using the HiMAT aircraft as a representative remotely
piloted research vehicle.
What this says is:
1.
"The vehicle was flown with cockpit display instruments until the landing
approach phase of the flight when the camera aboard the aircraft was activated
to provide the pilot with a television display during the approach."
2. During the operational phase of the
HiMAT program, a simulator was used to adjust the control laws for the primary
control system. The display presented to the pilot of this simulated system
was a display of an instrument landing system (ILS).
3.
Separately, a study was undertaken to compare
evaluations of pilots using a simulated visual display
of the runway scene and a simulated ILS display
with the results of actual flight tests, using the HiMAT aircraft as a
representative remotely piloted research vehicle.
There is no mention of a terrain database or any suggestion
that the simulated visual display of the runway scene was ever used to control a
real aircraft. It was never anything other than a simulation.
Sarrafian does not show a picture of the ILS display. He
probably assumed that anyone reading the report in 1984 would know what one
looks like.
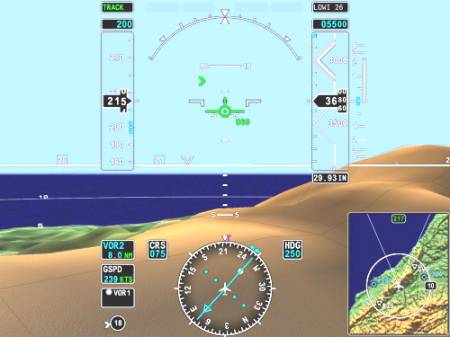
The following is a
modern picture and an explanation of an ILS display from NASA {Ref. 12}. Note that the sky above the horizon line
is blue; the ground below the horizon line is brown. There is no depiction of
terrain. This looks a great deal like what is now known as a Primary Flight
Display.
Instrument Landing System (ILS)
An
aircraft on an instrument landing approach has a cockpit with computerized
instrument landing equipment that receives and interprets signals being from
strategically placed stations on the ground near the runway. This system
includes a "Localizer" beam that uses the VOR indicator with only one radial
aligned with the runway. The Localizer beam's width is from 3° to 6°. It also
uses a second beam called a "glide slope" beam that gives vertical information
to the pilot. The glide slope is usually 3° wide with a height of 1.4°. A
horizontal needle on the VOR/ILS head indicates the aircraft's vertical
position. Three marker beacons (outer, middle and inner) are located in front of
the landing runway and indicate their distances from the runway threshold. The
Outer Marker (OM) is 4 to 7 miles from the runway. The Middle Marker (MM) is
located about 3,000 feet from the landing threshold, and the Inner Marker (IM)
is located between the middle marker and the runway threshold where the landing
aircraft would be 100 feet above the runway.
The VOR indicator for an ILS system uses a horizontal
needle in addition to the vertical needle. When the appropriate ILS frequency is
entered into the navigation radio, the horizontal needle indicates where the
aircraft is in relation to the glide slope. If the needle is above the center
mark on the dial, the aircraft is below the glide slope. If the needle is below
the center mark on the dial, the aircraft is above the glide slope.
The following is a picture of the image Sarrafian produced
in his simulator (Figure 9 - Simulated landing approach
conditions on glideslope):
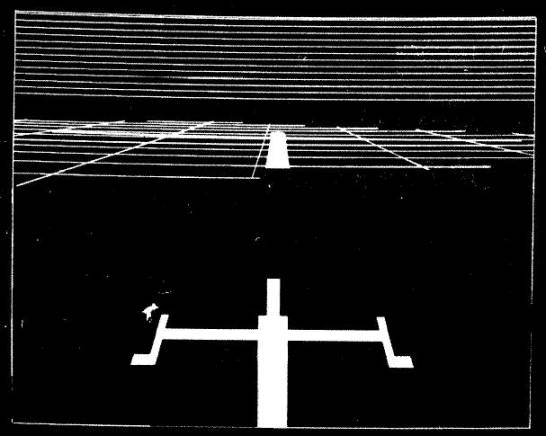
The display was created with an Evans and Sutherland
Picture System {Ref. 16} using a calligraphic monitor. The term calligraphic means that the
system only drew lines and dots. This type of system is also called Random Scan because the
electron beam in the CRT can be moved anywhere on the screen, as opposed to a
Raster Scan system, which draws a raster. Atari's term for Random Scan was XY or Vector and was used in
several games in the late 1970s and early 1980s such as Asteroids, BattleZone,
and Star Wars.
The solid
areas are filled-in by drawing lots of lines.
The lines above the horizon are presumably meant to
indicate the sky. The grid lines are presumably meant to indicate the ground.
There is no suggestion that the grid lines are produced from a digital elevation
database. There would be no reason to use a digital elevation database because
the system was used only to simulate landings. (Indeed, the name of the study
is "Simulator Evaluation of a Remotely Piloted
Vehicle Lateral Landing Task Using a Visual
Display.")
Another HiMAT report is THE ROLE OF SIMULATION IN THE DEVELOPMENT AND FLIGHT TEST
OF THE HIMAT VEHICLE by M. B. Evans and L. J. Schilling {Ref. 13}.
From Evans and Schilling:
Visual Landing Aid
Actual. - Cues to the pilot during landing included the cockpit
instruments, ILS/glideslope error indicators, television transmission from the
vehicle, calls on the radio from the chase pilot, and space-positioning calls
from the flight-test engineer.
Simulation model. - For most of the program, the landing cues for the pilot
in a HiMAT simulation included only the instruments, mapboards, and the
ILS/glideslope error indicators. Although these are all valid cues, they could
not achieve the same effect as the television transmission used in actual
flight. During flight, as soon as the pilot can identify the runway, his scan
focuses more on the television picture and less on the cockpit instruments. To
help alleviate this lack of fidelity in the simulation, a display of the runways
on the dry lakebed was developed on a recently purchased Evans and Sutherland
Graphics System.
HiMAT was actually flown using cockpit instruments,
ILS/glideslope error indicators, television transmission from the vehicle, calls
on the radio from the chase pilot, and space-positioning calls from the
flight-test engineer.
It was not flown using synthetic vision.
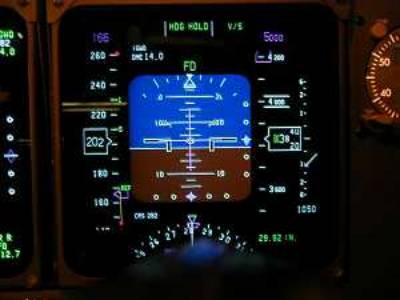
The AUVSI Authors have reproduced a picture in their
article with the caption, “The HiMAT RPV remote cockpit showing synthetic vision
display. Photo
courtesy of NASA.”
This picture is identical to the picture in Sarrafian
Figure 5 {Ref. 11},
August 1984, PDF page 10} but the Sarrafian picture has a different caption. It
says, “ HiMAT simulation cockpit.”
|
The HiMAT RPV remote cockpit showing synthetic vision display. Photo
courtesy of NASA. |
|

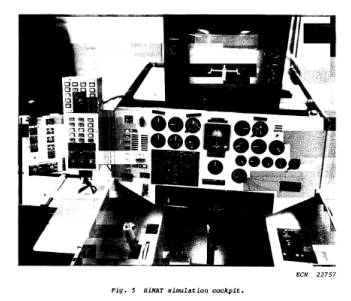
The monitor shows a picture of the kind shown in Sarrafian
Figure 8 or Figure 9 (along with a considerable amount of what appears to be
reflected glare). The picture was produced by an Evans and Sutherland Picture System which requires a
calligraphic monitor.
Here’s the thing. "The vehicle was flown with cockpit
display instruments until the landing approach phase of the flight when the
camera aboard the aircraft was activated to provide the pilot with a television
display during the approach."
In order to display the video from the camera aboard the
aircraft, the Ground Cockpit that controlled the aircraft had to have a
raster-scan monitor.
Raster-scan monitors and Calligraphic monitors are
incompatible.
The picture shows the Simulation Cockpit, and the
Simulation Cockpit could not be used to control the aircraft.
Why did the AUVSI Authors change the caption?
Visual-Proprioceptive
Cue Conflicts in the Control of Remotely Piloted Vehicles, Reed,
1977
In paragraph 9 the AUVSI Authors state:
Also in 1979, the Air Force published research identifying
human factors problems that would have to be overcome in RPV cockpit design
("Visual- Proprioceptive Cue Conflicts in the Control of Remotely Piloted
Vehicles" by Reed in 1977). NASA would use this in the design of the HiMAT RPV
3D visual system in 1984.
Ref. 14 provides the link to the Reed report.
This is what the Reed report was about:
1. From page 5 (PDF page 8):
An operator is asked to maneuver a remotely piloted vehicle
(RPV) from an airborne control station (a mother ship). This station is equipped with a television monitor,
control stick, and other controls and displays necessary to maneuver the RPV
through a specified course. The RPV, containing a television camera mounted in
its nose, relays an image of the terrain to be displayed on the television
monitor in the control station. Thus, the visual scene displayed to the operator
represents the scene viewed by the camera. The task of the operator is to use
the controls and displays to "fly" the RPV in much the same way he would fly a
conventional aircraft.
The scenario
is complicated by several factors. First, the visual inputs to the operator from
the RPV are independent of the motion inputs from the control station. Thus, the
operator will experience motion cues that are uncorrelated with the visual
inputs received from the RPV. Second, while
traditional pilot training programs operate on the philosophy that
proprioceptive cues provided by the motion of the aircraft should be
disregarded, research has shown that these cues are compelling, not easily
ignored, and may improve performance when used in training simulators (see, for
example, Borlace, 1967; Cohen, 1970; Douvillier, Turner, McLean, & Heinle,
1960; Fedderson, 1961; Huddleston & Rolfe, 1971; Rathert, Creer, &
Douvillier, 1959; Ruocco, Vitale, & Benfari, 1965). The task simulated in
the experiment presented here, however, required that the RPV operator disregard
sensations of motion in order to maintain adequate performance. Under conditions
of visual -proprioceptive conflict (as when the mother ship and/or the RPV are
in turbulence) the stereotypic responses of pilots to correct angular
accelerations will be inappropriate.
2. From page 7 (PDF page 10):
Visual system. The visual system consisted of a three-dimensional terrain model (a modified SMK-23 Visual Simulator, The Singer Company), television camera and optical probe, and three monochromatic television monitors. The terrain model provided “real-world ground cues for visual tracking over the surface. The real-world to terrain model scale was 3,000:1 and represented a six by twelve-mile (9.65 by 19.3 km) area. The model was mounted on an endless belt that was servo-driven to represent the continuous changes in scene as the simulated RPV traveled along north-south directions. A television camera viewed the terrain model through an optical probe that contained a servoed mechanical assembly to permit the introductions of heading, roll, and pitch. Both the camera and probe were mounted on a servo-driven carriage system that moved across the terrain model to simulate movement of the RPV along east-west directions and in and out to simulate altitude changes.
The SMK-23 was also used in The Lunar Roving Vehicle (LRV)
simulator {Ref. 15}. This shows what an SMK-23 looks
like.
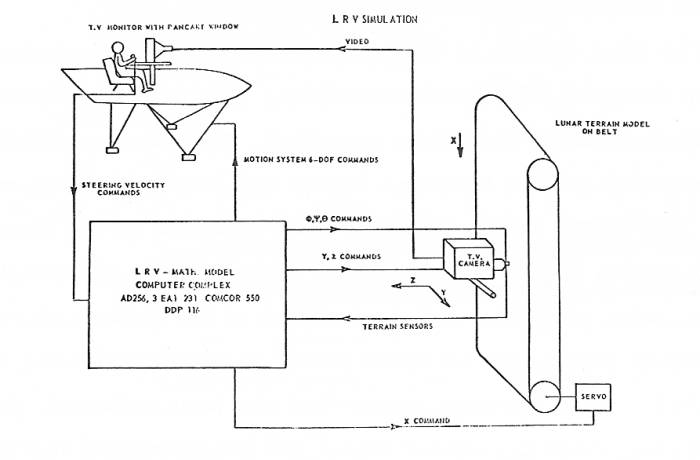
The SMK-23 used a television camera with an optical probe
to fly over the terrain model contained on a servo-driven endless belt.
If Reed had had synthetic
vision why would he have used the SMK-23 mechanical contraption?
The only link between Reed and HiMAT is that the HiMAT
aircraft could be landed by either a ground-based pilot or an airborne
controller (the backseat chase pilot in the TF-104G aircraft). {Ref 13 – Evans & Schilling, PDF page 9}
Actual.- The backup control system (BCS) is the second of
the two independent flight control systems required for the Hi MAT program. The
BCS control law is resident in one of the two onboard digital computers. The BCS
is a full-authority, three-axis, multirate digital controller with stability
augmentation functions and mode command functions (ref. 4). Each of seven modes
is semiautomatic with the pilot providing direction by way of discrete command
inputs. The BCS commands elevons for pitch and roll control and rudders for yaw
control, and has an autothrottle for speed modulation.
The BCS was designed to provide well-controlled dynamics
throughout the flight envelope, to have the ability to recover from extreme
attitudes, and to bring the vehicle to a selected site
and effect a successful landing by either a ground-based pilot or an airborne
controller (the backseat chase pilot in the TF-104G aircraft). It was
designed to provide these features for an unstable vehicle configuration of no
more than 10-percent aft mean aerodynamic chord center-of-gravity location. The
original HiMAT BCS was developed by Teledyne Ryan Aeronautical for the onboard
microprocessor computer, and was programmed entirely in Intel 8080 assembly
language.
While HiMAT might have used the results of the Reed report
to select the airborne controller (the backseat chase pilot in the TF-104G
aircraft) Reed did not use synthetic vision and neither did HiMAT.
The AUVSI Authors describe several flight simulators, such
as the RC AeroChopper by Ambrosia Microcomputer Products [Paragraphs 15 and 16]
and Bruce Artwick’s “Flight Simulator” for the Apple II, which ultimately became
Microsoft Flight Simulator. [Paragraph 5]
RC AeroChopper was developed by David R. Stern at Ambrosia
Microcomputer Products. The following is from an email correspondence with Mr.
Stern:
Question 1: Did AeroChopper use a 3D terrain database?
Mr.
Stern: I guess
it did, although the ground was a plane with 3D objects (and a 2D runway)
scattered around (trees, pylon, towers with crossbar to fly under).
Question 2: If
so, did it represent real terrestrial terrain?
Mr.
Stern: No.
Question 3: Did AeroChopper do real 3D?
Mr.
Stern: Yes.
All the objects including the aircraft were described by a list of points, a
list of point pairs for lines and a list of which points were in each polygon,
each point had an x,y and z component. The original version was started in 1984,
shown at the first R/C show (I think in Storm Lake Iowa) in the summer of 1986,
had only vector graphics. About 1990 I changed to filled polygons. The aircraft
was rotated (pitch, yaw and roll) slightly each frame with respect to the fixed
coordinate system. Then the aircraft and all background objects were rotated and
scaled depending on the relative position of the "camera".
The view on the screen was
initially from a fixed point about eye level for a standing R/C pilot. The
"camera" rotated to keep the aircraft on the screen. In the late 80s, I added
two different viewpoint options ("camera" flying near the aircraft) . One mode
was just behind the aircraft, looking in the direction the aircraft was pointed.
The second camera mode followed the aircraft to keep it from getting too far
away but slowed and stopped as the aircraft got closer. You can often see the
ground objects from the air in these modes.
I developed the first version on the Atari 520 ST computer
in 68000 assembly language. Then I developed an Amiga version and then a
Macintosh version. In about 1991, I developed an 80286 version for a DOS
machine. (The latest version requires a Windows 98 or older machine with an
RS232 port and runs under DOS)
RC AeroChopper was a significant achievement for the home
computers available at the time and was a highly regarded simulator {Ref. 17} but:
1. It did not use a digital elevation database;
“... the ground was a plane with 3D objects (and a 2D runway)
scattered around (trees, pylon, towers with crossbar to fly under),” and thus,
did not represent real terrestrial terrain.
2. It did not provide a computer-generated image of the external scene topography from the perspective of the
flight deck that is derived from aircraft attitude,
high-precision navigation solution, and database of terrain, obstacles and
relevant cultural features.
It was not synthetic vision. It was a simulator.
Now, let’s discuss Microsoft Flight Simulator {Ref. 18}:
Flight Simulator 5.1 was released in 1995. Microsoft Flight
Simulator did not start using 3D terrain until Flight Simulator 2000 Pro,
released in late 1999.
From Ref. 19:
GRAPHICS
We now have another complete globe to fly around. With the new mesh style scenery we have real elevation points that make the surrounding terrain rise and fall like the real earth. We have no more flat areas that just pop up into place at the last minute during a landing approach!
Even then, it is not clear if the terrain database
represents real terrain or is made up.
The article mentions the new GPS feature:
737 Panel
The 737-400 panel is very nicely done. Simple, yet effective. This is where FS2000 is not much different than FS98. However, the overall clarity, coloring, detailing and some new systems make it much better. We now have nice popups for the throttle quadrant, radio stack, compass and best of all the new GPS.
The GPS is part of the simulated 737 control panel. There
is no suggestion that a physical GPS unit can be connected to the program.
A simulator is not synthetic vision. A simulator might do a
good job simulating synthetic vision. It might even use a Digital Terrain
Elevation Database representing real terrestrial terrain, but that does not make
it synthetic vision. It is a simulator. If it does not control a physical
aircraft it is not synthetic vision.
When Did NASA Start Working on Synthetic Vision?
From Ref 20:
NEWS RELEASE
May 28, 1999
Synthetic Vision Could Help General Aviation Pilots Steer Clear of Fatalities
Hampton,
Virginia -- Research
Triangle Institute and six companies are teaming up to develop revolutionary new
general
aviation cockpit displays to give pilots clear views of their surroundings in bad
weather and darkness.
The RTI Team includes Flight
International, Inc., Newport News, Virginia. (a GA aircraft user) and Archangel Systems,
Inc., Auburn,
Alabama, who are committed to early commercialization and will make
significant cost share contributions. The starting point for the new system is
Archangel's
TSO'd and STC'd Cockpit Display System.
RTI also has teamed with
Seagull Technology, Inc., Los Gatos, California (a GPS and attitude/heading
reference system technology firm), Crew Systems, Inc., San Marcos, Texas, (a designer of
low-cost head up displays), and Dubbs & Severino, Inc.,
Irvine, California (an award-winning terrain database design company). In addition, FLIR
Systems, Inc.,
Portland, Oregon (an infrared instrument manufacturer) has agreed to
evaluate the costs and benefits of existing weather penetrating sensor technology.
Limited visibility is the greatest factor in most fatal aircraft accidents, according to the Aviation Safety Program at NASA's Langley Research Center in Hampton, VA. The RTI team is among six selected by NASA to develop different applications of Synthetic Vision.
The RTI team will design,
develop, and certify a Synthetic Vision system for general aviation aircraft.
The purpose is to reduce or eliminate controlled flight into terrain caused by
visibility-induced human error.
Synthetic Vision is a
display system that will offer pilots an electronic picture of what's
outside their windows, no matter the weather or time of day. The system combines
Global Positioning Satellite signals with terrain databases and
graphical
displays to draw
three-dimensional moving scenes that will show pilots exactly what's outside.
The NASA Aviation Safety
Program envisions a system that incorporates multiple sources of data into cockpit
displays. The
displays would show hazardous terrain, air traffic, landing and approach
patterns, runway surfaces and other obstacles that could affect an aircraft's flight.
The NASA Aviation Safety Program is a partnership with the FAA, aircraft manufacturers, airlines and the Department of Defense. This partnership supports the national goal announced by President Clinton to reduce the fatal aircraft accident rate by 80 percent in 10 years and by 90 percent over 25 years.
Research Triangle Institute
is an independent, not-for-profit organization that conducts R&D and provides technical
services to industry and government. With a staff of more than 1,600 people, RTI is
active in aerospace and many other fields of applied technology. RTI was created
in 1958 as the
centerpiece of North Carolina's Research Triangle Park, where its
headquarters are located. RTI's Aerospace Technology Center in
Hampton, Virginia, will carry out the Synthetic Vision project.
In a separate press release dated May 13, 1999 NASA
announced {from Ref. 21}:
Industry teams submitted 27 proposals in four categories: commercial transports and business jets, general aviation aircraft, database development and enabling technologies. NASA and researchers from the Federal Aviation Administration and Department of Defense evaluated the proposals' technical merit, cost and feasibility. NASA has committed $5.2 million that will be matched by $5.5 million in industry funds to advance Synthetic Vision projects over the next 18 months. More money is expected to be designated later to accelerate commercialization and make some systems available within four to six years. Among the team leaders selected for the first phase of the program are: Rockwell Collins, Inc., Cedar Rapids, IA; AvroTec, Inc., Portland, OR; Research Triangle Institute, Research Triangle Park, NC; Jeppesen-Sanderson, Inc., Englewood, CO; the Avionics Engineering Center of Ohio University, Athens, OH; and Rannoch Corporation, Alexandria, VA. Rockwell Collins, Inc. will receive funds to develop synthetic vision for airliners and business jets. The AvroTec, Inc. and Research Triangle Institute groups will use their awards to create technologies for a general-aviation synthetic vision system. A team led by Jeppesen-Sanderson, Inc. will receive funds to develop terrain database requirements and system approaches. The Avionics Engineering Center of Ohio University and Rannoch Corporation will use their awards to design specific component technologies for Synthetic Vision.
When did NASA start working on Synthetic Vision?
The answer is: 1999.
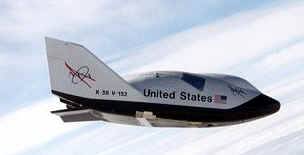
When did NASA first use synthetic vision to control a
UAV?
It was in the X-38 project.
From Ref 22: "Virtual Cockpit Window" for a Windowless Aerospacecraft
Wednesday, January 01
2003
A software
system processes navigational and sensory information in real time to generate a
three- dimensional- appearing image of the external environment for viewing by
crewmembers of a windowless aerospacecraft. The design of the particular
aerospacecraft (the X-38) is such that the addition of a real transparent
cockpit window to the airframe would have resulted in unacceptably large
increases in weight and cost.
When exerting
manual control, an aircrew needs to see terrain, obstructions, and other
features around the aircraft in order to land safely. The X-38 is capable of
automated landing, but even when this capability is utilized, the crew still
needs to view the external environment: From the very beginning of the United
States space program, crews have expressed profound dislike for windowless
vehicles. The well-being of an aircrew is considerably promoted by a
three-dimensional view of terrain and obstructions. The present software system
was developed to satisfy the need for such a view. In conjunction with a
computer and display equipment that weigh less than would a real transparent
window, this software system thus provides a "virtual cockpit window."
The key problem in the development of this software system
was to create a realistic three-dimensional perspective view that is updated in
real time. The problem was solved by building upon a pre-existing commercial
program — LandForm C3 — that combines the speed of flight-simulator software
with the power of geographic-information-system software to generate real-time,
three-dimensional-appearing displays of terrain and other features of flight
environments. In the development of the present software, the pre-existing
program was modified to enable it to utilize real-time information on the
position and attitude of the aerospacecraft to generate a view of the external
world as it would appear to a person looking out through a window in the
aerospacecraft. The development included innovations in realistic horizon-limit
modeling, three-dimensional stereographic display, and interfaces for
utilization of data from inertial-navigation devices, Global Positioning System
receivers, and laser rangefinders. Map and satellite imagery from the National
Imagery and Mapping Agency can also be incorporated into displays.
The Press Release from Rapid Imaging Software, Inc., which did the synthetic
vision work for the X-38, states {Ref. 23}
On December 13th, 2001, Astronaut Ken Ham successfully flew
the X-38 from a remote cockpit using LandForm VisualFlight as his primary
situation awareness display in a flight test at Edwards Air Force Base,
California. This simulates conditions of a real flight for the windowless
spacecraft, which will eventually become NASA's Crew Return Vehicle for the ISS.
We believe that this is the first test of a hybrid synthetic vision system which
combines nose camera video with a LandForm synthetic vision display. Described
by astronauts as "the best seat in the house", the system will ultimately make
space travel safer by providing situation awareness during the landing phase of
flight.
Other References cited by the AUVSI Authors
"Pathway-in-the-Sky Contact Analog Piloting Display," Knox
and Leavitt, 1977
In the article the AUVSI Authors state in Paragraph 7:
In 1977, NASA researcher Charles Knox published
"Pathway-in-the-Sky Contact Analog Piloting Display," which included a complete
design for a synthetic vision system. It featured a computer that projected a 3D
view of the terrain given an aircraft's position and orientation. This
out-the-window perspective view was displayed on a CRT type display. Such
displays were called "Pictorial Format" avionics systems, but we recognize them
as containing all of the essential elements of a modern synthetic vision
display.
The pictures that will be reproduced shortly are from the
Knox report (Charles E. Knox and John Leavitt). I have placed them with the
descriptions from Knox pages 3-4. The complete Knox report is Ref. 24.
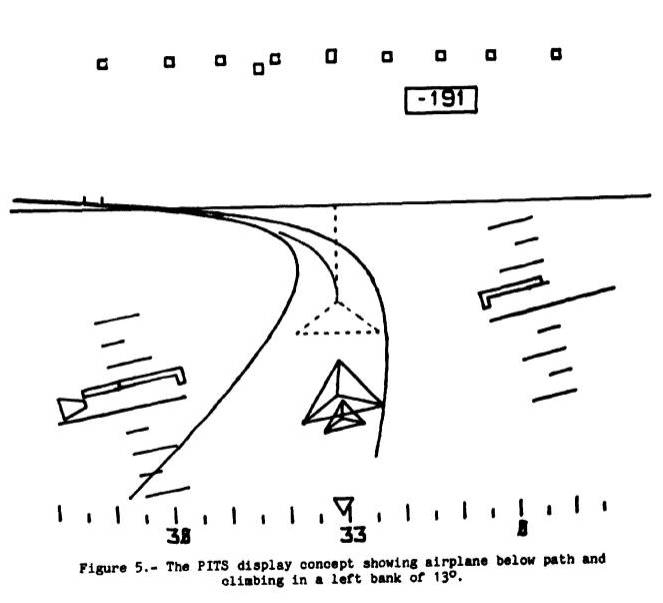
Everything comes together in Knox Figure 4, which shows the
Airplane track-angle pointer and scale, the Airplane symbol with shadow
superimposed, the Flight-path-angle scale, the Flight-path prediction vector,
the Earth horizon, the Roll pointer, the Airplane altitude deviation from path,
the Airplane flight-angle bars, the Programmed path-angle indicator, the
Potential flight-path-angle box, and the Programmed flight path.
The Programmed flight-path consists of two
three-dimensional lines showing the predicted flight path of the airplane. Knox
and Leavitt’s work is significant but there is no terrain, there is no digital
elevation database. There is no synthetic vision.
From Knox Description of Path-in-the-Sky Contact Analog Piloting Display {Ref. 24}:
Display Symbology
The format of the PITS contact analog display shows
airplane attitude information in the form of bank angle and pitch changes.
Airplane performance information is shown in the form of airplane flight-path
angle and flight-path acceleration (which may be used as thrust- or
energy-management control). Both vertical and lateral path deviations during a
tracking task are shown in pictorial form.
Path-tracking situation information is shown through a
combination of an airplane symbol, a vertical projection of the airplane symbol
with an extended center line drawn at the altitude of the path, a flight-path
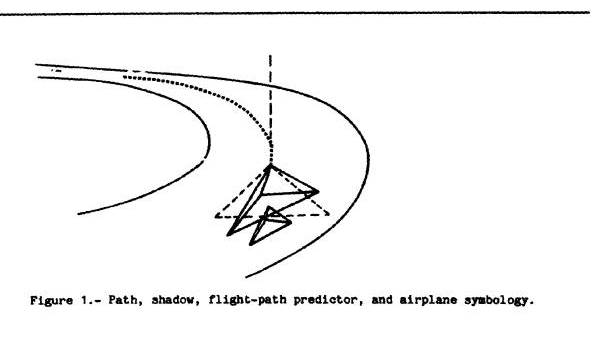
predictor, and a drawing of the programed path (fig. 1). These four pieces
of symbology are drawn in a perspective display format as if the observer's
eye were located behind and above the airplane.
The airplane symbol is a tetrahedron with a smaller
tetrahedron at the tail to visually enhance pitch changes. The airplane's true
position with respect to the path is at the symbol's apex. The symbol
rolls and pitches about its apex in accord with the real airplane's
attitude.
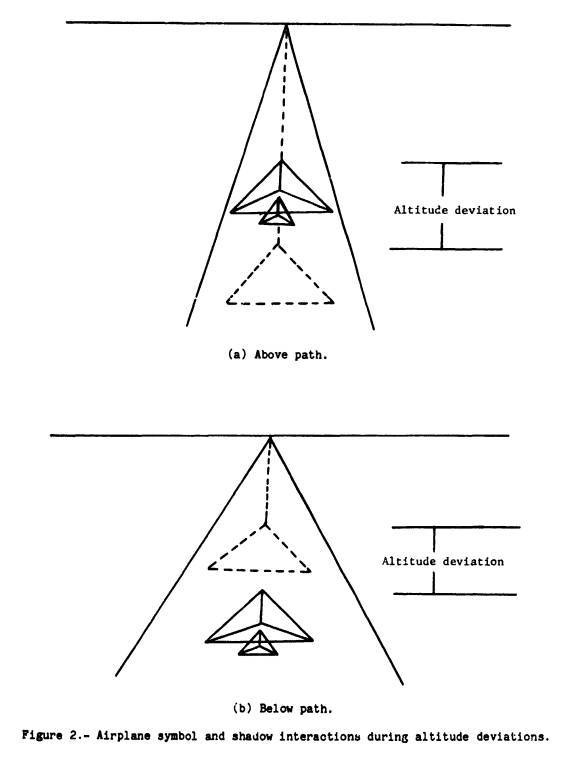
Altitude deviations from the programed path are indicated
to the pilot pictorially by a vertical projection of the airplane
symbol. The projection, drawn with dashed lines, may be thought of as a shadow; as
shown in figure 2, it remains directly above or below the airplane at the
altitude of the path. If the airplane is above the programed path, the shadow
appears to be below the airplane symbol. If the airplane is below the programed
path, the shadow appears to be above the airplane symbol.
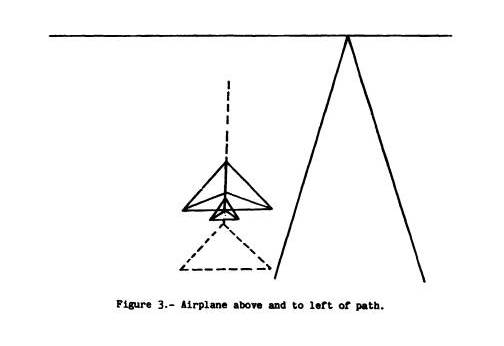
Since the shadow is always drawn directly above or below the airplane symbol, the pilot may readily identify lateral tracking deviations when they are combined with a vertical tracking error. Figure 3 shows the perspective view of the shadow, the airplane symbol, and the path when the airplane is above and to the left of the path.
Altitude deviations from the programed path are also shown to the pilot in numerical form in a box in the upper right-hand corner of the display (fig. 4). The pilot is expected to use this information when the path and shadow are out of the display field of view, such as could occur during initial path captures.
A flight-path prediction vector (fig. 4) in the horizontal plane is attached to the shadow. The prediction vector, indicated by a dashed line, shows the airplane's predicted path for the next 10 sec based on the airplane's present bank angle and ground speed. An extended shadow center line drawn from the apex of the shadow in the direction of the present track angle, is also shown to aid the pilot with the lateral tracking task.
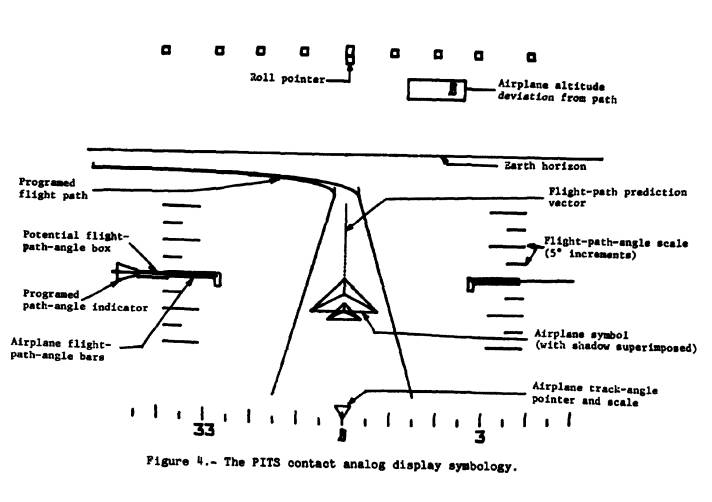
Figure 5 shows the flight-path prediction vector and the present track indicator with the airplane in a left bank of 13°.
“The Electronic Terrain Map: A New Avionics
Integrator," Small, D.M., 1981
In the article the AUVSI Authors state in Paragraph 8:
In 1979, the U.S. Air Force completed its "Airborne
Electronic Terrain Map Applications Study" and in 1981 published "The Electronic
Terrain Map: A New Avionics Integrator" describing how a computerized terrain
database could be displayed as an out-the-window 3D view allowing the pilot to
"see" even at night and in other limited visibility situations.
No, Small did not describe “how a computerized terrain
database could be displayed as an out-the-window 3D view allowing the pilot to
‘see’ even at night and in other limited visibility situations.”
The Small report discusses the concept of a digital
Electronic Terrain Map (ETM) and proposes that it be used for:
1.
Navigation;
2.
Terrain Following/Terrain Avoidance (TF/TA);
3.
Threat avoidance, analysis, warning, and display;
4.
Terrain Masking;
5.
Weapon delivery;
6.
Route planning.
He does say, “An electronic map subsystem can generate perspective
scenes, which are essentially computer generated images of the surrounding area,
and an electronic map should be much easier to interpret,” but:
1.
The statement must be understood according to the meaning
it would have had at the time the article was written (circa 1981); and
2.
Wishing for a desired result is not the same as teaching
how to do it.
This is what the Small report {Ref. 25} is
about:
From the section INTRODUCTION:
INTRODUCTION
Currently, the Air Force has in the inventory paper and
film map systems, which were developed to support the high and level flight
environment. These maps were an effective means of tapping the vast files of
information stored in the Defense Mapping Agency (DMA) data base, when the crew
had time to study and interpret them (in fact, much of their value was actually
obtained from pre-flight mission preparations). Interviews with pilots indicate that paper maps are less
useful for low altitude flights. Film maps with CRT annotation are somewhat
better, but still have a fundamental limitation in that it takes an operator to
access any information. That is, it is not possible to transfer information
directly from the data base to any other avionics system when it is stored on
paper or film maps in what is essentially an analog form.
The map reading process is a demanding task that can be
simplified by using a digital map subsystem which accesses the information
needed and presents it in a form which can be easily
interpreted. At low altitude, and with a line of sight limited to the
next ridge line, it's very difficult to interpret standard paper maps, which are
presented as a vertical projection of a large area. An
electronic map subsystem can generate perspective scenes, which are essentially
computer generated images of the surrounding area, and an electronic map
should be much easier to interpret. In addition, essential information from the
map data base can be placed on the pilots Head Up Display, reducing the need for
head down operations.
Paper maps are clumsy to use, whether you are flying an
aircraft or driving a car. An electronic map, if properly done, would make using
a map easier.
However, whether the map is electronic or on paper, you
still have to know where you are. Small has not addressed that issue in this
section.
The issue of what Small might mean by “perspective scenes”
will be addressed later.
From the section FUTURE AIRCRAFT SYSTEM:
FUTURE AIRCRAFT SYSTEM
The purpose of adding an ETM subsystem to a future avionics
suite is to provide map data and displays that can be interfaced with other
subsystems to improve the performance of the terrain
following/terrain avoidance (TF/TA), threat
avoidance and navigation avionics subsystems.
The requirement for the simultaneous exchange of processed map data by three or
four avionics subsystems will be the most difficult objective and important
feature of the ETM. Development and incorporation of the advanced ETM concepts
and technologies will be required to augment future
threat avoidance, navigation, TF/TA, and weapon delivery avionics
subsystems. Applications/examples of using these ETM concepts and/or
technologies and the utilization of an ETM subsystem as a source of information
follows.
TF/TA
The first example will be the automatic TF/TA avionics
subsystem. Our existing automatic TF subsystems operate
using only active sensors as sources of terrain profile information (i.e.
radar). This makes the subsystem totally dependent on the limitations of
this single information source. In case of radar, range
is limited to line of sight. Absolutely no information is available beyond line
of sight. This forces the TF subsystem to provide unnecessarily large
clearances over ridges to avoid the following peak which may or may not be
imminent. Further, the TF subsystem must radiate on an
almost continuous basis to provide a continuous terrain profile.
Consequently detection and jamming are TF subsystem vulnerabilities. A digital terrain map could provide a second source of
information to the TF flight command processing subsystem and the use of the map
could serve as a backup in case of radar failures or jamming. The ETM could provide information concerning beyond line of
sight conditions, enlarge the total field of view scanned for turning, and avoid
the reduction of the duty cycle of the radar emission. In fact, this ability
to scan the terrain to the side without turning and looking beyond the line of
sight makes it possible for the first time to consider true automation of the TA
function. Because of limitations in the existing DMA
data base, the approach should be cautious and an active sensor will be needed
to make absolute clearance measurements. None the less, the application of
stored data, to the TF/TA problem can potentially have tremendous impact on Air
Force capabilities in the low altitude flight mission.
1.
Existing Terrain Following systems use active radar to
profile the terrain. The radar is line-of-sight, so it cannot see farther
terrain hidden by closer terrain.
2.
An Electronic Terrain Map would allow you to determine what
is over the next ridge. However, “Because of limitations in the existing DMA
data base, the approach should be cautious and an active sensor will be needed
to make absolute clearance measurements.
You still need to know where you are so you can locate your
position on the map.
THREAT AVOIDANCE
The second example will be the threat avoidance avionics
subsystem. The whole purpose of low altitude missions is to reduce the
probability of detection and attrition. If the threat avoidance problem is
solved without regard to the location and lethal range of threats, the resultant
path may place the aircraft in greater jeopardy than before. Terrain masking and
launch dynamics limitations must be exploited to the fullest. Careful selection
of the aircraft’s routes to the target may be done by the crew or automatically.
In either case, a digital map is required to provide the terrain information and
the position of the threats identified by the avionics system. Pre-mission
planning can provide a starting point for this analysis, but the dynamics of the
threat assessment makes it essential that the crew be able to redefine the
mission as new information is received from command and control functions or via
the aircraft’s own suite of threat defense sensors.
1. If you have a good terrain map you can use
the terrain to hide your aircraft from those whom you do not want to know where
you are or if you are even in the area.
2. If your terrain map shows you where the
threats are, don’t go there.
You still have to know your map position.
NAVIGATION
The third example will be the navigation avionics
subsystem. With the addition of a correlator to the avionic suite and using the
on-board sensors together with the ETM, navigation can be accomplished. Also, by
displaying the ridge lines derived from stored terrain data on the head up
display, passive navigation is possible. Hence, the ETM could also improve the
utilization of the navigation subsystem.
Small does not say what he means by a “correlator” or which
onboard sensors he would use them with.
There can be several types of “correlators.”
1. You can visually look out your aircraft
window at the terrain (mountains, lakes, rivers) and cultural features (towers,
highways) and then look at a map and try to find them. Then you figure out where
you would be on the map to see what you are seeing. The map can be paper or
electronic. An example of a paper map converted to digital format is in Ref 26. This is part of the Washington Sectional
Aeronautical Chart, Scale 1:500,000 55th Edition, published March 3, 1994 by
U.S. Department of Commerce National Oceanic and Atmospheric Administration
National Ocean Service. Click Here for map PDF. If you are not
familiar with the symbology used in paper sectional maps here is the Washington Legend.
If you use the Zoom and Pan features of Acrobat you will
see the advantages of an electronic version of a paper map (i.e., a digital
map).
2. You can use a computer to do the correlation,
such as the method taught by Horn and Bachman in Using Synthetic Images to Register Real Images with Surface
Models. {Ref. 27}
Abstract: A number of image analysis tasks can benefit from
registration of the image with a model of the surface being imaged. Automatic navigation using visible light or radar
images requires exact alignment of such images with digital terrain models. In
addition, automatic classification of terrain, using satellite imagery, requires
such alignment to deal correctly with the effects of varying sun angle and
surface slope. Even inspection techniques for certain industrial parts may be
improved by this means.
Small has not mentioned Terrain
Referenced Navigation. In Terrain Referenced Navigation a Radar or Lidar is
used to take a few elevation measurements of the terrain. These measurements are
matched to the terrain in a digital terrain elevation database.
An early example of Terrain Referenced Navigation is U.S.
Patent 3,328,795 Fixtaking Means and Method issued
June 27, 1967 to Hallmark. {Ref 28} From Column 2, lines 18-53:
Previously proposed fixtaking and navigational systems have
sought to utilize terrain elevation data, and they have been based upon the
analog comparison of sample data which are the continuous, analog representation
of continuous
variations in terrain elevations, with similar data contained in contour
maps employed as such. At least some of the sample and known data hence have
always been graphically or photographically displayed on actual sheets of paper,
rectangles of photographic film, etc., and the values represented thereby have
been shown as physically measurable along at least two axes. Because of the
nature of the data employed, cumbersome and unwieldly equipments for
photographic development, superposition of map over map, orthogonal adjustments
of one set of data relative to another, etc. have been unavoidable sources of
added weight, complexity, error, and malfunction.
The present invention does not employ continuously recorded, analog data, but has as one of its bases the use of quantized terrain altitude information taken at discrete points. A numerical comparison of sample and prerecorded data is performed at high speed, and with results predictable and repeatable for the same inputs, by a digital computer. Since the digital computer and associated components are relatively unaffected by noise, vibrations, nuclear radiation, etc., no equipment is required for performing two-dimensional data comparisons, and no feedback or nulling circuitry is needed for determining the point of best physical correlation of the sample with the pre-recorded data. As distinguished from systems utilizing analog information, the digital computer is free from the sources of error unavoidably present where analog comparisons are made and hence is not only more accurate but is able to tolerate relatively large errors in sample and known data values without compromising fixtaking accuracy.
TERCOM (Terrain Contour Matching) uses contour matching
instead of elevations. U.S. Patent 4,347,511
Precision navigation apparatus issued August 31, 1982 to Hofmann , et al. (Ref. 29} mentions (Column 1, lines 52 – 62):
"Aviation Week & Space Technology", Feb. 25, 1974, page 50, ff, discloses the Tercom process. In the latter, barometric measuring devices and radio altimeters produce altitude profiles during specific time intervals of a flight over characteristic terrain. The one-dimensional differential profile between the barometric altitude and altitude above ground is compared with a two-dimensional reference profile. Here, the measured altitude profile is adjusted until the best correlation is achieved, so that the exact position of the aircraft results.
There are some problems with Terrain Referenced Navigation
and Tercom:
- They are not reliable if the terrain changes after the
Digital Terrain Map is made. Terrain can change seasonally due to snow
accumulations or permanently due to vegetation growth (trees) or new buildings
(technically, a cultural feature).
- They do not work over large flat terrain. {See Ref. 30}
- They do not work over bodies of water.
Although Terrain Referenced Navigation and Tercom systems
that use Radar or Lidar still send out signals that can be detected, the signals
are far less detectable than the signals used in Small’s description of TF/TA
systems. Small’s TF/TA system uses a radar to scan the terrain, which is why it
cannot see beyond the next ridge.
Small’s omission of Terrain Referenced Navigation and
Tercom is puzzling.
Small gives a choice between Radar-scanned terrain and
finding your location on a map using an undefined method of adding a correlator to the avionic suite and using the on-board
sensors together with the Electronic Terrain Map (ETM).
What did Small mean when he said, “An electronic map
subsystem can generate perspective scenes, which are essentially computer
generated images of the surrounding area, and an electronic map should be much
easier to interpret?”
In the 1980s (and well into the 1990s) the conventional
wisdom was that Real 3D graphics was too computationally intensive to do in real
time without large and very expensive hardware.
Honeywell was the leader in avionics. Harris was probably a
close second. They both spent the 1980s and 1990s competing with each other to
see who could do the best fake 3D.
For example, U.S. Patent 4,660,157 Real time
video perspective digital map display method issued April 21, 1987 to
Beckwith, et al. {Ref. 31}
Instead of mathematically rotating the points from the
database the '157 Patent accounts for the aircraft's heading by controlling the
way the data is read out from the scene memory. Different heading angles result
in the data being read from a different sequence of addresses.
From Column 3, lines 21 -
38:
The addresses of the elevation data read out of the scene memory representing points in the two-dimensional scene of the terrain are then transformed to relocate the points to positions where they would appear in a perspective scene of the terrain. Thus, each point in the two-dimensional scene is transformed to its new location in the perspective scene to be displayed on the viewing screen, and in the process, the data is automatically oriented with a heading-up disposition. The transformed points are then stored in a speed buffer for further processing by sun angle and line writing logic prior to being stored in a display memory from which data is read out to the display screen. Since data in the display memory represents one-to-one data to be displayed on the CRT, this data will be referred to as pixels (picture elements) in terms of its storage in the display memory for transfer to the CRT display.
The '157 patent accounts for the roll attitude of the aircraft by mathematically rotating the screen data after it is projected. From Column 12, lines 42 - 47:
The points which are output by the perspective transform circuit 110 are supplied to a screen rotation circuit 120 which serves to rotate the display data in accordance with the roll of the aircraft so that the display will accurately depict the view as it would appear, if visible, through the window of the aircraft.
Beckwith displays only points.
Fake 3D + Only Points does not qualify as what is now
considered synthetic vision.
There is Honeywell’s U.S. Patent 5,179,638 Method and apparatus for generating a texture mapped
perspective view issued January 12, 1993 to Dawson, et al. (Ref. 32}
It even has the word “perspective” in the title, but the
perspective it produces is a trapezoidal perspective, not a real 3D projected
perspective.
Dawson ‘638 incorporates by reference a number of other
patents and patent applications, and determining exactly what Dawson meant in
‘638 requires following a trail through these patents. The short version is that
what Dawson means by “perspective” is contained in U.S. Patent 4,884,220 Address Generation with
Variable Scan Patterns issued November 28, 1989 to Dawson (again), {Ref. 33} which is incorporated by reference by Dawson
'638.
After discussing
the shortcomings of prior art, Dawson '220 says (Column 2, line 56 through
Column 3, line 2):
This invention differs from the prior methods of
perspective view generation in that a trapezoidal scan pattern is used instead
of the radial scan method. The trapezoidal pattern is generated by an orthographic
projection of the truncated view volume onto the cache memory (terrain data).
The radial scan concept is retained, but used for an intervisibility overlay
instead of the perspective view generation. The radial scan is enhanced to
include a full 360 degree arc with programmable attributes. The rectangular
pattern retains the parallel scan methodology for plan view map generation. Both
a nearest neighbor and a full bilinear interpolation method of scan address
generation are implemented.
And now we know what Dawson means
by "perspective."
A real 3D perspective is a 3D projection.
Anything else is Fake 3D.
If you think Fake 3D is just as good as Real 3D then the
next time someone owes you money tell them that it’s ok to pay you in fake
dollars.
There is also the matter that Small is only wishing for a
desired result. Wishing for a desired result is not the same as teaching how to
do it.
Not only did Small not teach it, he was not clear in saying what he was wishing for.
VCASS: An Approach to Visual Simulation, Kocian, D., 1977
In the article the AUVSI Authors state in Paragraph 6:
This emergence of computer flight simulation in the 1970s
appears to have sparked a monumental amount of research. The U.S. Air Force
began its Visually Coupled Airborne Systems Simulator (VCASS) program, with a
particular eye toward future-generation fighter aircraft ("VCASS: An Approach to
Visual Simulation," Kocian, D., 1977).
The Kocian report is available in Ref. 34.
Summary
Kocian is about using a Helmut Mounted Display (HMD) with a
Head Position Sensing System to replace large expensive hemispherical display
systems used in simulators. The simulator is used to develop the visual
interface used by crew members to control advanced weapon systems. This visual
interface can then be used in airborne operations.
During simulation a representative visual scene is
generated by the graphics or sensor imagery generators but, from Paragraph 11
(emphasis added):
For an airborne VCASS capability, it is only necessary to
install the VCS components along with a small airborne general purpose computer
in a suitable aircraft and interface a representative programmable symbol generator to an on-board attitude reference
system in order to synthesize either airborne or ground
targets.
The airborne version does not synthesize a visual scene, so
it is not synthetic vision.
Details
A Visually-Coupled System is one that visually couples the
operator to the other system components through the use of a Helmut Mounted
Display (HMD) and Helmut Position Sensor. From Paragraph 9:
The key components of VCASS will be VCS hardware which
includes the HMS and HMD. These components are used to "visually-couple" the
operator to the other system components he is using. AMRL has pioneered efforts
in the research, development and testing of these hardware techniques.
A system using a Helmut Mounted Display with a Helmut
Position Sensor is less expensive than the hemispherical projection systems
being used and produces better results. Paragraph numbers have been added to the
following paragraphs from Kocian.
[1]
In recent years Air Force operational units have experienced a continuing
trend downward in the number of flight hours in aircraft that can be provided to
each individual pilot for training and maintaining proficiency. This comes at a
time when aircraft systems are becoming ever more complex and sophisticated
requiring comparatively more hours for training to maintain the same relative
flying proficiency. With increasing costs for fuel and aircraft and the failure
of DoD funding to keep pace with these costs, the trend is almost sure to
continue. In adjusting to the realities of keeping overall experience at a
satisfactory level and reducing costs, procurement of aircraft simulators has
become a necessity.
[2]
The rapid proliferation of simulators with no standard technical criteria
as a guide has resulted in the evolution of several different design approaches.
Most existing visual scene simulators utilize electro-optical devices which
project video imagery (generated from a sensor scan of a terrain board or a
computer generated imagery capability) onto a hemispherical dome or set of large
adjacent CRT displays arranged in optical mosaics with the weapon, vehicle, and
threat dynamics being provided by additional computer capabilities.
[3]
These large fixed-base simulators suffer from the following drawbacks.
The majority of the visual projection techniques used in these simulators do not
incorporate infinity optics which provide collimated visual scenes to the
operator. Those which do are large and expensive and incorporate large CRT
displays. The luminance levels and resolution of these displays are usually low
and do not represent true ambient conditions in the real environment.
Additionally, hemispherical infinity optics are difficult to implement and this
technique requires excessive computer capacity to generate imagery due to the
need for refreshing an entire hemisphere instantaneously, regardless of where
the crew member is looking. In this regard, existing computer capability is not
used effectively to match the channel capacity of the human visual system. There
are also generally no stereoscopic depth cues provided for outside of-cockpit
scenes. Another important drawback to these simulators is that the visual
simulation is not transferrable to the actual flight environment, i.e., the
ground-based system cannot be transferred to an actual aircraft to determine
simulation validity. Finally, most existing techniques are very expensive and do
not allow the flexibility of incorporating other display design factors such as
different head-up display image formats, fields-of-view (FOV), representative
cockpit visibilities, and optional control and display interfaces.
[4]
A quite different approach to solving the visual presentation problems of
aircraft simulators is to employ the use of visually coupled systems (VCS). For
many years it has been the mission of the Aerospace Medical Research Laboratory
to optimize the visual interface of crew members to advanced weapon systems.
This mission has been primarily pursued in two areas: (1) the establishment of
control/display engineering criteria; and (2) the prototyping of advanced
concepts for control and display interface. An important part of fulfilling this
mission has been the development of VCS components which includes head position
sensing systems or helmet mounted sights (HMS), eye position sensing systems
(EPS) and helmet mounted displays (HMD).
During simulation a representative visual scene is
generated by the graphics or sensor imagery generators. From Paragraph 7:
A more detailed analysis of
the problem has produced a set of characteristics which a more ideal aircraft
simulator might possess. Of primary importance is that
it should be a flexible visual scene simulation providing synthesized
out-of-the-cockpit visual scenes and targets, a representative vehicle whose
type can be altered, threat and weapon dynamics, flexibility of control and
display configurations, and inputs from sensor or real world imagery. It should
be portable if possible and provide alternatives for crew station display
options including number and configuration. This
simulator should also be useable in both simulated air-to-ground weapon
delivery and air-to-air engagement scenarios. Finally,
it should be possible to use the same system in ground fixed base and motion
base simulators as well as in aircraft.
However, the airborne version does not synthesize the
out-the-cockpit visual scene. It only displays the symbols used in its role as a
weapons controller. That is why the airborne version only needs a small airborne
general purpose computer. From Paragraph 11 (emphasis added):
For an airborne VCASS capability, it is only necessary to
install the VCS components along with a small airborne
general purpose computer in a suitable aircraft and interface a
representative programmable symbol generator to an
on-board attitude reference system in order to
synthesize either airborne or ground targets. This approach has the ultimate flexibility of utilizing
the same symbol set,
threat dynamics, etc., in the air that were originally used in the ground
simulation. In either case, the crew member will engage electronic targets
(either air-to-air or air-to-ground) and launch electronic weapons. His
performance in these tasks in turn will be recorded and assessed for performance
or utilized as training aids for the crew member or operator.
The airborne version does not synthesize a visual scene, so
it is not synthetic vision as the term is now used.
In addition, the Kocian report describes a work-in-progress. From Paragraph 19:
The design considerations involved in building a
helmet-mounted display for the VCASS simulation present a more formidable
and subjective set of problems whose solution is not entirely
clear. It is certain that a larger display field-of-view is
required but how large remains an unanswered question. The optical physics that
are part of the display design imposed constraints which are difficult to
resolve. Currently, an interim display possessing a 60 degree instantaneous
field-of-view is planned for the VCASS; however, recent studies have shown that
this may not be large enough especially when viewed with one eye. This leads
naturally to biocular or binocular configurations. A whole host of human factors
problems then becomes important including brightness disparity, display
registration, and eye dominance. The decision whether or
not to include color also becomes a major design decision not only because
of the engineering development required but because user acceptance may weigh
heavily on this factor.
(The question whether or not to use color was later settled. The answer was color.)
U.S. Patent 5,566,073 Pilot Aid Using A Synthetic Environment
issued October 15, 1996 to Margolin
This patent was not mentioned by the AUVSI Authors.
Abstract
A pilot aid using synthetic reality consists of a way to determine the aircraft's position and attitude such as by the global positioning system (GPS), a digital data base containing three-dimensional polygon data for terrain and manmade structures, a computer, and a display. The computer uses the aircraft's position and attitude to look up the terrain and manmade structure data in the data base and by using standard computer graphics methods creates a projected three-dimensional scene on a cockpit display. This presents the pilot with a synthesized view of the world regardless of the actual visibility. A second embodiment uses a head-mounted display with a head position sensor to provide the pilot with a synthesized view of the world that responds to where he or she is looking and which is not blocked by the cockpit or other aircraft structures. A third embodiment allows the pilot to preview the route ahead or to replay previous flights.
It teaches what is now known as synthetic vision in
sufficient detail that it may be practiced by a Person
having Ordinary Skill In The Art without undue experimentation. A Person
having Ordinary Skill In The Art (POSITA) is a legal term that is often fought
over during patent litigation.
This patent is a continuation of Application Ser. No. 08/274,394, filed Jul. 11, 1994, which is its filing priority date. The earliest known description of the invention is in Ref. 35.
For those unfamiliar with Patent Law, the Claims are the
legal definition of the invention. The purpose of the Abstract is to provide
search terms only.
See Ref. 36 for the patent. (I am the inventor named in the patent.)
U.S. Patent 5,904,724 Method and apparatus for remotely piloting an aircraft
issued May 18, 1999 to Margolin
This patent was also not mentioned by the AUVSI
Authors.
Abstract
A method and apparatus that allows a remote aircraft to be controlled by a remotely located pilot who is presented with a synthesized three-dimensional projected view representing the environment around the remote aircraft. According to one aspect of the invention, a remote aircraft transmits its three-dimensional position and orientation to a remote pilot station. The remote pilot station applies this information to a digital database containing a three dimensional description of the environment around the remote aircraft to present the remote pilot with a three dimensional projected view of this environment. The remote pilot reacts to this view and interacts with the pilot controls, whose signals are transmitted back to the remote aircraft. In addition, the system compensates for the communications delay between the remote aircraft and the remote pilot station by controlling the sensitivity of the pilot controls.
It teaches the use of synthetic vision (as the term is
currently used) for remotely piloting an aircraft. It teaches it in sufficient
detail that it may be practiced by a Person having Ordinary Skill In The Art
without undue experimentation.
This patent was filed January 19, 1996, which is its
priority date.
For those unfamiliar with Patent Law, the Claims are the
legal definition of the invention. The purpose of the Abstract is to provide
search terms only.
See Ref. 37 for the patent. (I am
the inventor named in the patent.)
U.S. Patent Application Publication 20080033604
System and Method For Safely Flying Unmanned Aerial
Vehicles in Civilian Airspace
In the interests of full disclosure I have the following
patent application pending: U.S. Patent Application Publication 20080033604 System and Method For Safely Flying Unmanned Aerial
Vehicles in Civilian Airspace.
Abstract
A system and method for safely flying an unmanned aerial vehicle (UAV), unmanned combat aerial vehicle (UCAV), or remotely piloted vehicle (RPV) in civilian airspace uses a remotely located pilot to control the aircraft using a synthetic vision system during at least selected phases of the flight such as during take-offs and landings.
See Ref. 38 for the published patent application. (I am the inventor named in the application)
The Future of Synthetic Vision
This is what the AUVSI Authors have said about synthetic
vision [Paragraph 2]:
More recently it has evolved away from being a piloting aid
to a potentially powerful tool for sensor operators.
and [Paragraph 22]:
The recent availability of
sophisticated UAS autopilots capable of autonomous flight control has
fundamentally changed the paradigm of UAS operation, potentially reducing the
usefulness of synthetic vision for supporting UAS piloting tasks. At the same
time, research has demonstrated and quantified a substantial improvement in the
efficiency of sensor operations through the use of synthetic vision sensor
fusion technology. We expect this to continue to be an important technology for
UAS operation.
While I have no doubt that synthetic vision is very useful to the sensor operator, the news that its use in piloting UAVs is on its way out came as a big surprise to me.
The AUVSI Authors have an ulterior motive in making the statements. Their real objective is to make people believe synthetic vision no longer has value in controlling Remotely Piloted Vehicles (aka UAVs) and that a Remotely Piloted Vehicle that is flown using an Autonomous control system is no longer a remotely piloted vehicle and therefore a sensor operator may use synthetic vision without infringing U.S. Patent 5,904,724. See Ref. 39 for the response Rapid Imaging Software’s attorney sent to Optima Technology Group in 2006.
The statements made by the AUVSI Authors form a distinction
without a difference unless there is a wall between the sensor operator and the
pilot that results in the sensor operator having no influence on how or where
the UAV is flown.
Consider the following scenarios:
1. The human sensor operator has synthetic
vision; the human pilot does not. No communications is allowed between the human
sensor operator and the human pilot lest the human sensor operator influence the
human pilot where or how to fly the aircraft. Otherwise, it might be considered
as contributing to piloting the aircraft. This results in a decidedly
sub-optimal system.
2. The human sensor operator has synthetic
vision; the aircraft is flown autonomously (a machine pilot). No communications
is allowed between the human sensor operator and the machine pilot lest the
human sensor operator influence the machine pilot where or how to fly the
aircraft. Otherwise, it might be considered as contributing to piloting the
aircraft. This also results in a decidedly sub-optimal system.
There are legal and political ramifications to this
scenario.
Someone has to be responsible for the operation and safety
of the flight. The FAA defines “Pilot in Command” as {Ref. 5}:
Pilot in command means the person who:
(1) Has final authority and responsibility for the
operation and safety of the flight;
(2) Has been designated as pilot in command before or
during the flight; and
(3) Holds the appropriate category, class, and type rating,
if appropriate, for the conduct of the flight.
It is unlikely that FAA will allow this responsibility to
be delegated to a machine anytime soon. That’s where the political ramifications
come in. A UAV (especially a completely autonomous UAV) that injures
or kills civilians would ignite a political firestorm that would ground the
entire UAV fleet.
Since there must be a human in the loop to be responsible
for the operation and safety of the flight, that leaves a system where:
1. The human sensor operator has synthetic vision;
2. The pilot is a machine;
3. The operation and safety of the flight is
held by a human (different from the sensor operator) who is designated the
Pilot-in-Command;
4. No communications is allowed between the
human sensor operator and the machine pilot or the human sensor operator and the
human Pilot-in-Command lest the human sensor operator influence the machine
pilot or the human Pilot-in Command where or how to fly the aircraft. Otherwise,
it might be considered as contributing to piloting the aircraft. This also
results in a decidedly sub-optimal system.
Frankly, it is stupid to cripple the utility of a UAV
system in order to avoid paying a small patent licensing fee. Besides, the ‘724
patent is for the use of synthetic vision in a Remotely Piloted Aircraft. It is
not limited to the use of synthetic vision by the crew member designated as the
Pilot.
An autonomous pilot would have to be really good.
Even after 100 years of aviation, pilots still encounter
situations and problems that have not been seen before. The way they deal with
new situations and problems is to use their experience, judgment, and even
intuition. Pilots have been remarkably successful in saving passengers and crew
under extremely difficult conditions such as when parts of their aircraft fall
off (the top of the fuselage peels off) or multiply-redundant critical controls
fail (no rudder control). Computers cannot be programmed to display judgment.
They can only be programmed to display judgment-like behavior under conditions
that have already been anticipated. UAVs should not be allowed to fly over
people's houses until they are at least smart enough to turn on their own fuel
supply.
[ On Apr. 25, 2006 the Predator UAV being used by the U.S.
Customs and Border Protection agency to patrol the border crashed in Nogales,
Ariz. According to the NTSB report (NTSB Identification CHI06MA121) when the
remote pilot switched from one console to another the Predator was inadvertently
commanded to shut off its fuel supply and "With no engine power, the UAV
continued to descend below line-of-site communications and further attempts to
re-establish contact with the UAV were not successful." In other words, the
Predator crashed because the system did not warn the remote pilot he had turned
off the fuel supply and it was not smart enough to turn its fuel supply back on.
{Ref. 40} ]
An autonomous UAV assumes the computer program has no bugs.
Complex computer programs
always have bugs no matter how brilliant or motivated the programmer(s). As an
example, look at almost every computer program ever written.
An autonomous Unmanned Combat
Aerial Vehicle (UCAV) will have little chance against one flown by an
experienced pilot using Synthetic Vision until Artificial Intelligence produces
a sentient, conscious Being. At that point, all bets will be off because a
superior sentient artificial Being may decide that war is stupid and refuse to
participate. It may also decide that humans are obsolete or are fit only to be
its slaves.
I propose yearly fly-offs:
1. A UCAV flown and fought autonomously
against an F-22 (or F-35).
2. A UCAV flown and fought by a human
pilot using synthetic vision against an F-22 (or F-35).
3. A UCAV flown and fought by a human
pilot using synthetic vision against a UCAV flown and fought autonomously.
And that is the future of Unmanned Aerial Systems.
References
Reference 1 - Synthetic Vision Technology for Unmanned Systems: Looking
Back and Looking Forward by Jeff Fox, Michael Abernathy, Mark Draper and
Gloria Calhoun, AUVSI’s Unmanned Systems, December
2008, pages 27-28.
This article has been reproduced with the permission of the Association for Unmanned Vehicle Systems International (AUVSI), which is the world's largest non-profit organization devoted exclusively to advancing the unmanned systems community. AUVSI, with members from government organizations, industry and academia, is committed to fostering, developing, and promoting unmanned systems and related technologies. http://www.auvsi.org/
PDF: refs/ref01_auvsi.pdf
For the purposes of this response the article has been
converted to text and the paragraphs have been numbered for easy reference: refs/ref01_auvsi.htm .
Reference 2 – U.S. Patent 5,593,114 Synthetic
Vision Automatic Landing System issued January 14, 1997 to Ruhl (Assignee
McDonnel Douglas Corporation).
Html copy at USPTO Patent Database:
PDF copy (complete with drawings): refs/ref02_5593114.pdf
Reference 3 - Synthetic Vision Technology
Demonstration, Volume 1 of 4, Executive Summary; Synthetic Vision Program
Office Federal Aviation Administration; Malcolm A. Burgess, FAA; Terence Chang,
TRW; Dale E. Dunford, USAF; Roger H. Hoh, Hoh Aeronautics; Walter F. Home, GTRI;
Richard F. Tucker, TRW; December 1993. http://www.dtic.mil/srch/doc?collection=t2&id=ADA280564
Mirrored Copy: refs/ref03_old_faa_1993.pdf
Reference 4 – Multi-Crew Pictorial Format
Display Evaluation; AFWAL-TR-87-3047;
T.C. Way, R.L. Martin, J.G. Gilmour, M.E. Hornsby, R.E.
Edwards; Final Report For Period May 1984 – January 1987, Boeing Military
Airplane Company, February 1987.
http://handle.dtic.mil/100.2/ADA189349
Mirrored copy: refs/ref04_pictorial_format.pdf
Reference 5 – FAA current
definition of Synthetic Vision
FAA Title 14
Part 1
The FAA definition of synthetic vision from: http://ecfr.gpoaccess.gov/cgi/t/text/text-idx?c=ecfr&sid=41b1c51ea8ec4c9d1c5ebb94bbf28138&rgn=div8&view=text&node=14:1.0.1.1.1.0.1.1&idno=14
Mirrored Copy: refs/ref05_faa.pdf
Title 14: Aeronautics and
Space
PART 1—DEFINITIONS
AND ABBREVIATIONS
Synthetic vision means a computer-generated image of the external scene
topography from the perspective of the flight deck
that is derived from aircraft attitude, high-precision navigation solution, and database of terrain, obstacles and relevant cultural
features.
Synthetic vision
system means an electronic means to display a synthetic vision image of the
external scene topography to the flight crew.
Reference 6 – FAA Synthetic Vision is based on the use of a Digital Elevation Database
FAA SV Issues- Part 23 Position http://www.faa.gov/aircraft/air_cert/design_approvals/transport/media/Pt23ApproachSlides.pdf
Mirrored Copy: refs/ref06_Pt23ApproachSlides.pdf
Federal Aviation
Administration Part 23 Synthetic Vision Approval Approach
Presentation to: FAA Synthetic Vision Workshop
Name: Lowell Foster
Date: Feb 14,
2006
Page 13:
SV Issues - Part 23 Position
Terrain Data Confidence Issues Cont.
• Complete database accuracy
impossible to validate
• Everyone gets their data from the
same original source
•
Manufacturers are doing everything possible to verify the current data is
accurate, but that is really just a confidence builder
If accuracy of data base must be validated then SV is
unapproveable.
Page 14:
PositionRisk Management / Mitigation of Terrain Uncertainties
•No operational credit for SV –current minimums still apply
•Significant safety benefits possible –outweighs what we consider minimal risk
•Experience -large data base errors to date have been easy to recognize and report –very visible on PFD and map display
•Small data base errors such as an elevation point are likely to be insolated, so exposure to a misleading information situation is considered small
•Current resolution tends to round-up the elevation data so that small errors are not as significant and on the conservative side
Reference 7 – Digital Elevation Model: http://data.geocomm.com/dem/
Mirrored Copy: refs/ref07_usgs_dem.pdf
The USGS Digital Elevation Model (DEM) data files are
digital representations of cartographic information in a raster form. DEMs
consist of a sampled array of elevations for a number of ground positions at
regularly spaced intervals. These digital cartographic/geographic data files are
produced by the U.S. Geological Survey (USGS) as part of the National Mapping
Program and are sold in 7.5-minute, 15-minute, 2-arc-second (also known as
30-minute), and 1-degree units. The 7.5- and 15-minute DEMs are included in the
large scale category while 2-arc-second DEMs fall within the intermediate scale
category and 1-degree DEMs fall within the small scale category - (Source:
USGS)
Reference 8 – Digital Elevation Database improved by a Space Shuttle
mission.
http://spaceflight.nasa.gov/shuttle/archives/sts-99/
Mirrored Copy: refs/ref08_sts99.pdf
STS-99 Crew Works in Shifts to Complete Mapping
Mission
Endeavour's international crew of seven spent 11 days in
orbit during February 2000 mapping the Earth's surface with radar
instruments.
.
.
.
Space Shuttle Endeavour Maps the World in Three
Dimensions
The main objective of STS-99 was
to obtain the most complete high-resolution digital topographic database of the
Earth.
The Shuttle Radar Topography Mission, or SRTM, was an international project spearheaded by the National Imagery and Mapping Agency and NASA, with participation of the German Aerospace Center, DLR. SRTM consisted of a specially modified radar system that flew onboard the space shuttle during STS-99. This radar system gathered data that produced unrivaled 3-D images of the Earth's surface.
Reference 9 – Honeywell IFPD Synthetic Vision System
http://www.honeywell.com/sites/portal?page=ipfd_primus&smap=aerospace&theme=T5
Mirrored Copy: refs/ref09_honeywell.pdf
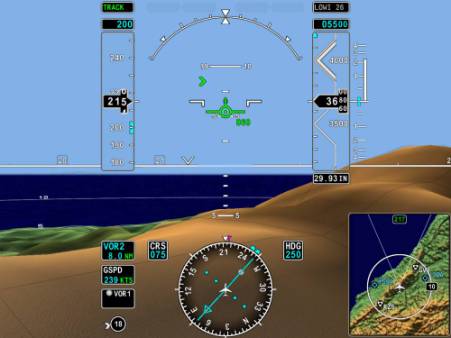
Reference 10 - NASA description of the HiMAT project:
http://www.nasa.gov/centers/dryden/news/FactSheets/FS-025-DFRC.html
Mirrored Copy: refs/ref10_nasa_himat.pdf
Reference 11 - Simulator Evaluation of a Remotely Piloted Vehicle Lateral
Landing Task Using a Visual Display, Shahan K. Sarrafian
NASA Technical Memorandum 84916 (May 1984):
http://www.nasa.gov/centers/dryden/pdf/87968main_H-1205.pdf
NASA Technical Memorandum 85903 (August 1984):
http://www.nasa.gov/centers/dryden/pdf/87986main_H-1246.pdf
refs/ref11b_sarrafian.pdf
I converted this article to text
in order to make it easier to search and to quote from.
refs/ref11c_sarrafian.doc .
The downloaded PDF file is the controlling version.
Reference 12 - NASA Aviation Navigation
Tutorial: http://virtualskies.arc.nasa.gov/navigation/tutorial/tutorial3.html
Mirrored copy: refs/ref12_nasa_ils.pdf
Reference 13 – THE ROLE OF SIMULATION IN THE DEVELOPMENT AND FLIGHT TEST
OF THE HIMAT VEHICLE , M. B. Evans and L. J. Schilling, NASA-TM-84912, April
1984
http://www.nasa.gov/centers/dryden/pdf/87962main_H-1190.pdf
Mirrored Copy: refs/ref13_evans_schilling.pdf
From PDF page 13:
Visual Landing Aid
Actual. - Cues to the pilot during landing included the cockpit
instruments, ILS/glideslope error indicators, television transmission from the
vehicle, calls on the radio from the chase pilot, and space-positioning calls
from the flight-test engineer.
Simulation model. - For most of the program, the landing cues for the pilot
in a HiMAT simulation included only the instruments, mapboards, and the
ILS/glideslope error indicators. Although these are all valid cues, they could
not achieve the same effect as the television transmission used in actual
flight. During flight, as soon as the pilot can identify the runway, his scan
focuses more on the television picture and less on the cockpit instruments. To
help alleviate this lack of fidelity in the simulation, a display of the runways
on the dry lakebed was developed on a recently purchased Evans and Sutherland
Graphics System.
Reference 14 - Visual-Proprioceptive Cue Conflicts in the Control of
Remotely Piloted Vehicles, Reed, 1977, AFHRL-TR-77-57
http://www.dtic.mil/srch/doc?collection=t2&id=ADA049706
http://handle.dtic.mil/100.2/ADA049706
Mirrored Copy: refs/ref14_reed.pdf
Page 5 (PDF page 8):
VISUAL PROPRIOCEPTIVE CUE CONFLICTS IN THE CONTROL OF
REMOTELY PILOTED VEHICLES
I. INTRODUCTION
An investigation was made of operator tracking performance
under conditions of visual proprioceptive conflict. (The term proprioception as used here refers to sensations
arising from the receptors of the nonauditory labyrinth of the inner car and
from muscles, tendons, and joints. Kinesthesis refers to sensations of movement
arising from the receptors other than the nonauditory labyrinth.) The
experimental scenario is described as follows: An operator is asked to maneuver
a remotely piloted vehicle (RPV) from an airborne control station (a mother
ship). This station is equipped with a television monitor, control stick, and
other controls and displays necessary to maneuver the RPV through a specified
course. The RPV, containing a television camera mounted in its nose, relays an
image of the terrain to be displayed on the television monitor in the control
station. Thus, the visual scene displayed to the operator represents the scene
viewed by the camera. The task of the operator is to use the controls and
displays to "fly" the RPV in much the same way he would fly a conventional
aircraft.
The scenario is complicated by several factors. First, the
visual inputs to the operator from the RPV are independent of the motion inputs
from the control station. Thus, the operator will experience motion cues that
are uncorrelated with the visual inputs received from the RPV. Second, while
traditional pilot training programs operate on the philosophy that
proprioceptive cues provided by the motion of the aircraft should be
disregarded, research has shown that these cues are compelling, not easily
ignored, and may improve performance when used in training simulators (see, for
example, Borlace, 1967; Cohen, 1970; Douvillier, Turner, McLean, & Heinle,
1960; Fedderson, 1961; Huddleston & Rolfe, 1971; Rathert, Creer, &
Douvillier, 1959; Ruocco, Vitale, & Benfari, 1965). The task simulated in
the experiment presented here, however, required that the RPV operator disregard
sensations of motion in order to maintain adequate performance. Under conditions
of visual -proprioceptive conflict (as when the mother ship and/or the RPV are
in turbulence) the stereotypic responses of pilots to correct angular
accelerations will be inappropriate.
The objectives of the experiment were to obtain data
applicable to the following.
1. The relative difficulty of controlling an RPV from an
airborne station under different visual-motion combinations (e.g., visual-motion
combinations that produce conflict, or no conflict).
2. The relative ability of pilots, navigators, and nonrated
Air Force officers to operate an RPV from an airborne station (i.e., the effect
of previous experience).
3. The differential effects of experience on the
acquisition of skills necessary to operate an RPV.
4. Selection and training of potential RPV operators.
5. The need for motion in RPV training simulators.
II. METHOD
Simulation System
This research utilized the Simulation and Training Advanced
Research System (STARS) facility of the Advanced Systems Division, Air Force
Human Resources Laboratory, Wright Patterson Air Force Base, Ohio. The equipment
consisted of an operator station mounted on a motion platform, hydraulic pump,
terrain model, television camera and optical probe, experimenter station, and a
Sigma 5 digital computer. A brief description of the hardware system is
presented as follows.
Operator station. The operator station, illustrated in Figure 1, was
designed to simulate the environment of an airborne control station. This
station contained a television monitor that provided visual images relayed to h
from a simulated RPV. These visual images were generated from a television
camera and optical probe, which viewed the terrain model. The path followed by
the camera and probe over the terrain model was commensurate with the vehicle
flight path as determined by control stick inputs provided by the subject. Since
the control stick and visual system were independent of the motion platform, the
capability existed for the subject to
5
[Figure 1. Operator station mounted on motion
platform. {not usable}]
maneuver the simulated RPV under various environmental
conditions. This arrangement permitted the introduction of conditions in which
the RPV alone, the airborne station alone, or both, were under air
turbulence.
The subject sat in an aircraft-type seat directly facing a
14- by 11-inch (35.6 by 27.9 cm) television monitor, which was mounted in a
center sectional panel of the operator console. The distance between the
subject’s eyes and the center of the television screen was 28 inches (71.1 cm).
The viewing angle subtended 28.07° in the lateral plane and 22.23° in the vertical plane of the monitor. An altimiter,
altitude warning light, and an attitude director indicator (ADI) were mounted on
a flat sectional panel to the left of the subject and at an angle of
45° from the center panel (See Figure 2). The altimeter was a
vertical straight-scaled indicator with a moving pointer that provided altitude
readings in feet above sea level. An amber altitude warning light flashed
whenever the simulated RPV altitude dropped to a level, below 180 feet (54.9 m),
remained on whenever altitude exceed 1,000 feet (304.8 m) and was off between
180 and 1,000 feet.
A 6-inch (15.2 cm) side-arm rate control stick was mounted
on the right-hand side console armrest (see Figure 2). The control was a
spring-centered stick with a dual-axis (fee positioning) capability that
required 4 ounces, (113.4 g) breakout force. The same amount of force was needed
to hold the stick at full deflection. The range of deflection on both lateral
(right - left) and longitudinal (fore - aft) stick was 0 to 25° (henceforth
referred to as 0 to 100 percent deflection).
In addition, the operator station contained a foot switch
to allow the subject to communicate with the experimenters. White noise was
input to the subject’s headset to mask external disturbances. The aircraft seat
was equipped with a standard harness and lapbelt to protect the subject. An air
conditioner maintained the station at 70° F (21.1° C). Finally, incident illumination was at an average of
.37 footcandles at eye level.
6
[Figure 2. Operator station instruments and control
stick. {not
usable}]
Motion system. The operator
station was mounted on a motion platform that provided onset cues in two degrees
of freedom of angular acceleration. Roll onset cues were provided by tilting the
simulator about the longitudinal axis (i.e., the X axis) and pitch onset cues
were provided by tilting the simulator about the lateral axis (i.e., the 'Y'
axis). Motion was achieved by actuation of hydraulic cylinders mounted under the
9- by 8-feet (2.74 by 2.4 m) simulator platform, as shown in Figure 1.
Visual system. The visual system consisted of a
three-dimensional terrain model (a modified SMK-23 Visual Simulator, The Singer
Company), television camera and optical probe, and three monochromatic
television monitors. The terrain model provided “real-world ground cues for
visual tracking over the surface. The real-world to terrain model scale was
3,000:1 and represented a six by twelve-mile (9.65 by 19.3 km) area. The model
was mounted on an endless belt that was servo-driven to represent the continuous
changes in scene as the simulated RPV traveled along north-south directions. A
television camera viewed the terrain model through an optical probe that
contained a servoed mechanical assembly to permit the introductions of heading,
roll, and pitch. Both the camera and probe were mounted on a servo-driven
carriage system that moved across the terrain model to simulate movement of the
RPV along east-west directions and in and out to simulate altitude changes. The
field of view represented on the television monitor subtended a viewing angle of
50° horizontally and 38° vertically over the terrain model. One
television monitor was mounted in the operator station and the other two were
located in the experimenter station. All three monitors had a 1,000-line
resolution vertically.
Experimenter station. The experimenter station contained the equipment
necessary to monitor the status of the hardware/software and control activities
of the subject, and to setup the various stimulus conditions. This station was
manned by two experimenters. The task of the first was to prepare the system for
operation, insure that all hardware was operating effectively and reliably prior
and during the experiment, and set up the conditions for all experimental trials
in accordance with a prepared check list. The task of the second experimenter
was to determine the appropriate time for introducing specific stimuli to the
subject. When certain criteria were met, the experimenter pressed a discrete
hand-held insert button to initiate a stimulus trial.
Computer system and interfaces. A Sigma 5 digital computer was used to drive the
peripkeral equipment, and to record data during experimental runs. Resident
software consisted of a real-time aerodynamic mathematical model, executive
routine, and data recording programs. The
7
Reference 15 - Lunar Driving Simulator History
http://www.knology.net/~skeetv/SimHist3.html
Mirrored copy: refs/ref15_lunar_driving_history.pdf
Reference 16 - Evans & Sutherland Picture System:
Short Brochure: http://www.computerhistory.org/brochures/companies.php?alpha=d-f&company=com-42b9d8b7f4191
Full Brochure: http://archive.computerhistory.org/resources/text/Evans_Sutherland/EvansSutherland.3D.1974.102646288.pdf
Mirrored copy:
Short Brochure: refs/ref16_esps_s.pdf
Full Brochure: refs/ref16_esps_f.pdf
Reference 17 – RC AeroChopper Review: http://www.atarimagazines.com/startv3n9/rcaerochopper.html
Mirrored Copy: refs/ref17_aerochopper.pdf
Reference 18 – Microsoft Flight Simulator
Microsoft Flight Simulator 5.1 Screen Shot: refs/ref18_fs5_1_screenshot.pdf
Microsoft Flight Simulator History: refs/ref18_fs_history.pdf
Reference 19 – Microsoft Flight Simulator’s first use of terrain points:
http://www.flightsim.com/cgi/kds?$=main/review/fs2000.htm
Mirrored copy: refs/ref19_fs_first.pdf
Reference 20 – News releases from RTI (Research Triangle Institute),
Avidyne, AvroTec, and NASA announcing NASA had selected those companies to
develop a synthetic vision system for General Aviation. www.jmargolin.com/refs/ref20_nasa1999.pdf
Reference
21: NASA press release, May 13, 1999, http://quest.nasa.gov/aero/news/05-13-99.txt
Mirrored copy: refs/ref21_nasa_pr.pdf
Michael Braukus
Headquarters, Washington, DC May 13, 1999(Phone: 202/358-1979)Kathy Barnstorff
Langley Research Center, Hampton, VA
(Phone: 757/864-9886)RELEASE: 99-59SYNTHETIC VISION COULD HELP PILOTS STEER CLEAR OF FATALITIES
NASA and industry are developing revolutionary cockpit displays to give airplane crews clear views of their surroundings
in bad weather and darkness, which could help prevent deadly
aviation accidents.
Limited visibility is the greatest factor in most fatal aircraft accidents, said Michael Lewis, director of the Aviation
Safety Program at NASA's Langley Research Center in Hampton, VA.
NASA has selected six industry teams to create Synthetic Vision,
a virtual-reality display system for cockpits, offering pilots an
electronic picture of what's outside their windows, no matter the
weather or time of day.
"With Global Positioning Satellite signals, pilots now can know exactly where they are," said Lewis. "Add super-accurate terrain databases and graphical displays and we can draw three-
dimensional moving scenes that will show pilots exactly what's
outside. The type of accidents that happen in poor visibility just don't happen when pilots can see the terrain hazards ahead."
The NASA Aviation Safety Program envisions a system that would use new and existing technologies to incorporate data into
displays in aircraft cockpits. The displays would show hazardous
terrain, air traffic, landing and approach patterns, runway
surfaces and other obstacles that could affect an aircraft's
flight.
Industry teams submitted 27 proposals in four categories: commercial transports and business jets, general aviation
aircraft, database development and enabling technologies. NASA and researchers from the Federal Aviation Administration and
Department of Defense evaluated the proposals' technical merit,
cost and feasibility.
NASA has committed $5.2 million that will be matched by $5.5 million in industry funds to advance Synthetic Vision projects
over the next 18 months. More money is expected to be designated later to accelerate commercialization and make some systems
available within four to six years.
Among the team leaders selected for the first phase of the program are: Rockwell Collins, Inc., Cedar Rapids, IA; AvroTec, Inc., Portland, OR; Research Triangle Institute, Research Triangle
Park, NC; Jeppesen-Sanderson, Inc., Englewood, CO; the Avionics
Engineering Center of Ohio University, Athens, OH; and Rannoch
Corporation, Alexandria, VA.
Rockwell Collins, Inc. will receive funds to develop synthetic vision for airliners and business jets. The AvroTec, Inc. and Research Triangle Institute groups will use their awards
to create technologies for a general-aviation synthetic vision
system. A team led by Jeppesen-Sanderson, Inc. will receive funds to develop terrain database requirements and system approaches. The Avionics Engineering Center of Ohio University and Rannoch
Corporation will use their awards to design specific component
technologies for Synthetic Vision.
The Aviation Safety Program is a partnership with the FAA, aircraft manufacturers, airlines and the Department of Defense. This partnership supports the national goal announced by President
Clinton to reduce the fatal aircraft accident rate by 80 percent
in 10
years and by 90 percent over 25 years.
Because of advances in the last 40 years, commercial airliners are already the safest of all major forms of
transportation. But with an accident rate that has remained relatively constant in the last decade and air traffic expected to
triple over the next 20 years, the U.S. government wants to
prevent a projected rise in the number of aircraft accidents.
For a complete list of industry teams please check the Internet at:
http://oea.larc.nasa.gov/news_rels/1999/May99/99-025.html - end -
Reference 22 – Virtual Cockpit Window" for a Windowless
Aerospacecraft, NASA Tech Briefs. January 2003, page 40. http://www.nasatech.com/Briefs/Jan03/MSC23096.html
Mirrored Copy: refs/ref22_nasa_techbriefs.pdf
"Virtual Cockpit Window" for a Windowless Aerospacecraft
Wednesday, January 01
2003
A software
system processes navigational and sensory information in real time to generate a
three- dimensional- appearing image of the external environment for viewing by
crewmembers of a windowless aerospacecraft. The design of the particular
aerospacecraft (the X-38) is such that the addition of a real transparent
cockpit window to the airframe would have resulted in unacceptably large
increases in weight and cost.
When exerting
manual control, an aircrew needs to see terrain, obstructions, and other
features around the aircraft in order to land safely. The X-38 is capable of
automated landing, but even when this capability is utilized, the crew still
needs to view the external environment: From the very beginning of the United
States space program, crews have expressed profound dislike for windowless
vehicles. The well-being of an aircrew is considerably promoted by a
three-dimensional view of terrain and obstructions. The present software system
was developed to satisfy the need for such a view. In conjunction with a
computer and display equipment that weigh less than would a real transparent
window, this software system thus provides a "virtual cockpit window."
The key problem
in the development of this software system was to create a realistic
three-dimensional perspective view that is updated in real time. The problem was
solved by building upon a pre-existing commercial program — LandForm C3 — that
combines the speed of flight-simulator software with the power of
geographic-information-system software to generate real-time,
three-dimensional-appearing displays of terrain and other features of flight
environments. In the development of the present software, the pre-existing
program was modified to enable it to utilize real-time information on the
position and attitude of the aerospacecraft to generate a view of the external
world as it would appear to a person looking out through a window in the
aerospacecraft. The development included innovations in realistic horizon-limit
modeling, three-dimensional stereographic display, and interfaces for
utilization of data from inertial-navigation devices, Global Positioning System
receivers, and laser rangefinders. Map and satellite imagery from the National
Imagery and Mapping Agency can also be incorporated into displays.
After further
development, the present software system and the associated display equipment
would be capable of providing a data-enriched view: In addition to terrain and
obstacles as they would be seen through a cockpit window, the view could include
flight paths, landing zones, aircraft in the vicinity, and unobstructed views of
portions of the terrain that might otherwise be hidden from view. Hence, the
system could also contribute to safety of flight and landing at night or under
conditions of poor visibility.
In recent
tests, so precise was the software modeling that during the initial phases of
the flight the software running on a monitor beside the video camera produced
nearly identical views.
This work was done by Michael F. Abernathy of Rapid Imaging
Software, Inc., for Johnson Space Center. For further information, please
contact Michael F. Abernathy, Rapid Imaging Software, Inc., 1318 Ridgecrest
Place S.E., Albuquerque, NM 87108. MSC-23096.
Reference 23 – Press Release from Rapid Imaging Software, Inc. (http://www.landform.com/pages/PressReleases.htm) which states (near the bottom of the page):
Mirrored copy: refs/ref23_ris.pdf

On December 13th, 2001, Astronaut Ken Ham successfully flew
the X-38 from a remote cockpit using LandForm VisualFlight as his primary
situation awareness display in a flight test at Edwards Air Force Base,
California. This simulates conditions of a real flight for the windowless
spacecraft, which will eventually become NASA's Crew Return Vehicle for the ISS.
We believe that this is the first test of a hybrid synthetic vision system which
combines nose camera video with a LandForm synthetic vision display. Described
by astronauts as "the best seat in the house", the system will ultimately make
space travel safer by providing situation awareness during the landing phase of
flight.
Reference 24 – Description of Path-in-the-Sky Contact Analog Piloting
Display, Charles E. Knox and John Leavitt, October 1977,
NASA Technical Memorandum 74057
http://ntrs.nasa.gov/archive/nasa/casi.ntrs.nasa.gov/19780002119_1978002119.pdf
Mirrored Copy: refs/ref24_knox.pdf
Reference 25 - "The
Electronic Terrain Map: A New Avionics Integrator", Small, D.M. USAF,
Avionics Laboratory, Wright-Patterson AFB, OH, AIAA-1981-2289. In: Digital Avionics Systems
Conference, 4th, St. Louis, MO, November 17-19, 1981, Collection of Technical
Papers. (A82-13451 03-04) New York, American Institute of Aeronautics and
Astronautics, 1981, p. 356-359. refs/ref25_small.pdf
Converted to text using OCR: refs/ref25_small.html
Reference 26 - This is part of the Washington Sectional Aeronautical
Chart, Scale 1:500,000 55th Edition, published March 3, 1994 by U.S. Department
of Commerce National Oceanic and Atmospheric Administration National Ocean
Service.
Map: refs/ref26_pmap1.pdf
Washington Legend showing paper map symbology: refs/ref26_pmap2.pdf
Reference 27 - Using Synthetic Images to Register Real Images with Surface
Models; Horn, Berthold K.P.; Bachman, Brett L. ; August 1977.
MIT DSpace: http://hdl.handle.net/1721.1/5761
Mirrored Copy: refs/ref27_horn.pdf
Abstract: A number of
image analysis tasks can benefit from registration of the image with a model of
the surface being imaged. Automatic navigation using
visible light or radar images requires exact alignment of such images with
digital terrain models. In addition, automatic classification of terrain, using
satellite imagery, requires such alignment to deal correctly with the effects of
varying sun angle and surface slope. Even inspection techniques for certain
industrial parts may be improved by this means.
Reference 28 - U.S. Patent 3,328,795 Fixtaking Means and Method issued June 27, 1967 to Hallmark.
USPTO Database (Does not have htmp version): http://patft.uspto.gov/netacgi/nph-Parser?Sect1=PTO1&Sect2=HITOFF&d=PALL&p=1&u=%2Fnetahtml%2FPTO%2Fsrchnum.htm&r=1&f=G&l=50&s1=3,328,795.PN.&OS=PN/3,328,795&RS=PN/3,328,795
PDF Version: refs/ref28_3328795.pdf
Reference 29 – U.S. Patent 4,347,511 Precision navigation apparatus issued August 31, 1982
to Hofmann, et al.
PDF Version: refs/ref29_4347511.pdf
Reference 30 – I don’t know if Terrain Referenced Navigation works over Kansas, but I know Kansas is flat. From: http://www.guardian.co.uk/education/2003/sep/25/research.highereducation2
This year, for instance, three geographers compared the flatness of Kansas to the flatness of a pancake. They used topographic data from a digital scale model prepared by the US Geological Survey, and they purchased a pancake from the International House of Pancakes. If perfect flatness were a value of 1.00, they reported, the calculated flatness of a pancake would be 0.957 "which is pretty flat, but far from perfectly flat". Kansas's flatness however turned out to be 0.997, which they said might be described, mathematically, as "damn flat".
Mirrored Copy: refs/ref30_kansas.pdf
Reference 31 - U.S. Patent 4,660,157 Real time video perspective digital map display method issued April 21, 1987 to Beckwith, et al.
Reference 32 – U.S. Patent 5,179,638 Method and
apparatus for generating a texture mapped perspective view issued January
12, 1993 to Dawson, et al.
Reference 33 - U.S. Patent 4,884,220 Address Generation with Variable Scan Patterns issued November 28, 1989 to Dawson et al.
Reference 34 - VCASS: An Approach to Visual Simulation, Kocian, D., 1977), Presented at the IMAGE Conference, Phoenix, Ariz., 17-18
May 77.
Available for purchase from DTIC http://www.dtic.mil/srch/doc?collection=t2&id=ADA039999
Mirrored Copy: refs/ref34_vcass.pdf
Converted to text using OCR (with the paragraphs numbered):
refs/ref34_vcass.htm
Reference 35 – The earliest known description of the invention that became U.S. Patent 5,566,073 Pilot Aid Using A Synthetic Environment. refs/ref35_pilotdoc.pdf
Reference 36 - U.S. Patent 5,566,073 Pilot Aid Using A Synthetic Environment issued October
15, 1996 to Margolin
Reference 37 – U.S. Patent 5,904,724 Method and apparatus for remotely piloting an aircraft issued May 18, 1999 to Margolin
Reference 38 - U.S. Patent
Application Publication 20080033604 System and Method
For Safely Flying Unmanned Aerial Vehicles in Civilian Airspace
Reference 39 - Letter sent to Optima Technology Group by Rapid Imaging Software attorney Benjamin Allison, dated October 13, 2006.
PDF: refs/ref39_ris.pdf
Reference 40 - NTSB Incident Report on crash
of Predator on April 25, 2006, northwest of Nogales, NM. NTSB Identification CHI06MA121
http://www.ntsb.gov/ntsb/brief.asp?ev_id=20060509X00531&key=%201
Mirrored Copy: refs/ref40_ntsb.pdf
.end